


In November 2024, Canada’s real estate market demonstrated strong growth, driven by lower borrowing costs and robust population increases. National home sales rose 7.7% month-over-month in October, with a 30% increase compared to the previous year. The
average home price reached $696,166, marking a 4% monthly and 6% annual rise, although the MLS Benchmark price showed slight declines.
Regionally, the Greater Toronto Area experienced consistent sales growth and a 0.8% monthly price increase to $1.09 million. Alberta set new price records, with Calgary and Edmonton showing significant annual growth of 13.8% and 11%, respectively. Interest rate cuts by the Bank of Canada fueled buyer activity, while population growth of 3% year-over year continued to drive demand. The outlook remains positive, although potential supply shortages may place further pressure on prices.
Toronto
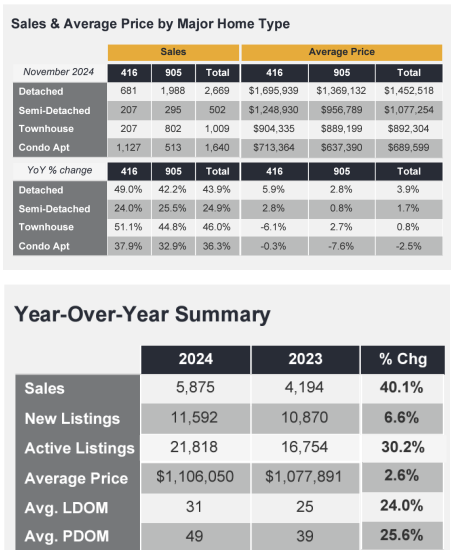
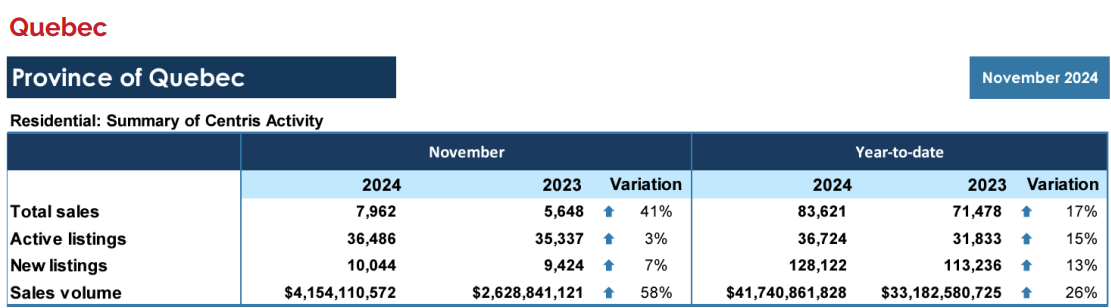
Vancouver Quebec In November 2024, GTA REALTORS® reported 5,875 home sales through TRREB’s MLS® System, marking a 40.1% increase from the 4,194 sales recorded in November 2023. New listings entered into the MLS® System totaled 11,592, reflecting a 6.6% year-over-year increase. Seasonally adjusted figures showed that November sales increased compared to October.
The MLS® Home Price Index (HPI) Composite Benchmark declined by 1.2% year-over-year in November 2024, representing a smaller annual decrease than in previous months. Meanwhile, the average selling price rose by 2.6% from November 2023, reaching $1,106,050. The stronger growth in the average price, compared to the HPI Composite Benchmark, is attributed to a higher proportion of detached home sales this year. On a seasonally adjusted basis, the average selling price experienced a slight decline compared to October.
Vancouver
In November 2024, Metro Vancouver’s real estate market experienced a 28% year-over-year increase in home sales, continuing the strong demand observed in October. A total of 2,181 residential sales were recorded, though this figure remained 12.8% below the 10-year seasonal average. New listings rose 10.6% year-over-year to 3,725, slightly exceeding the seasonal average, while active listings reached 13,245, reflecting a 21.2% annual increase.
The sales-to-active listings ratio stood at 17.1%, with detached homes at 12.7%, attached homes at 23.1%, and apartments at 18.7%. This balance kept prices stable; however, continued demand could exert upward pressure if listings fail to keep pace.
Benchmark prices were $1,172,100 for all homes (-0.9% YoY, stable MoM), $1,997,400 for detached homes (+1% YoY), $752,800 for apartments (-1.2% YoY), and $1,117,600 for townhouses (+1.8% YoY). Townhouses demonstrated the strongest sales growth, rising 42.7% year-over-year.
Explore the latest market insights and discover what’s driving real estate trends in November 2024—read the article now!
Data extracted in January 2025
