

Negotiator ∙ United
Joseph Goh
REN49950
Negotiator ∙ United
Joseph Goh
REN49950
About Joseph Goh
tsgoh9393@gmail.com
4 years at IQI
113 transactions
4 properties on sale
4 properties on rent
Contact Joseph Goh
Joseph Goh Social Links
No social links available.
Joseph Goh's Service Locations
Joseph Goh's Service Locations
My Listings
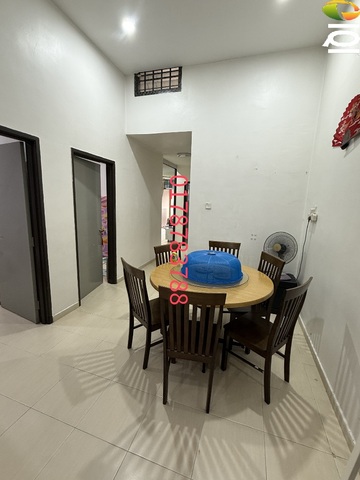
Taman Setia Indah
Jalan Setia
QAR 1,871 /month
Listed on July 14, 2026
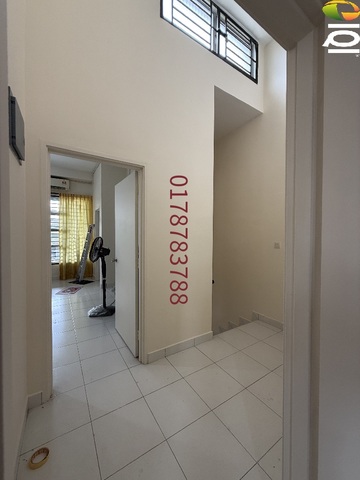
Taman Bukit Indah @ Iskandar Puteri
Jalan Indah
QAR 1,871 /month
Listed on July 18, 2026
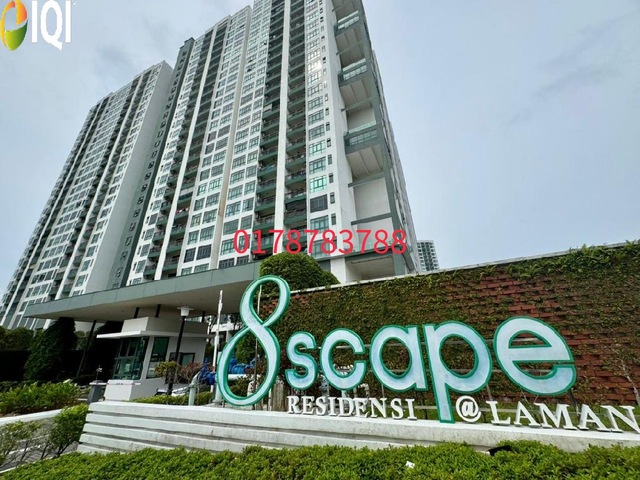
8scape Residences @ Sutera
Jalan Sutera
QAR 474,903
Listed on August 17, 2026

BANDAR BARU SERI ALAM
Jalan Lembah
QAR 2,093,850 /month
Listed on July 7, 2026

Eco Business Park 1
Jalan Perjiranan
QAR 14,256 /month
Listed on July 28, 2026
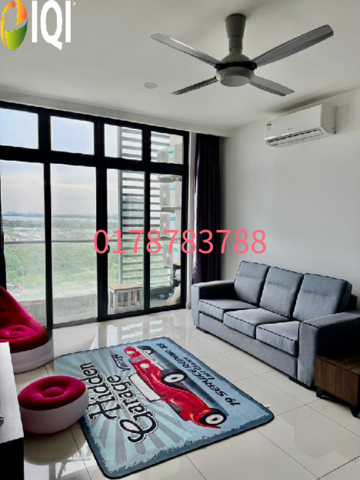
Green Haven
Kota Puteri
QAR 2,851
Listed on July 5, 2026
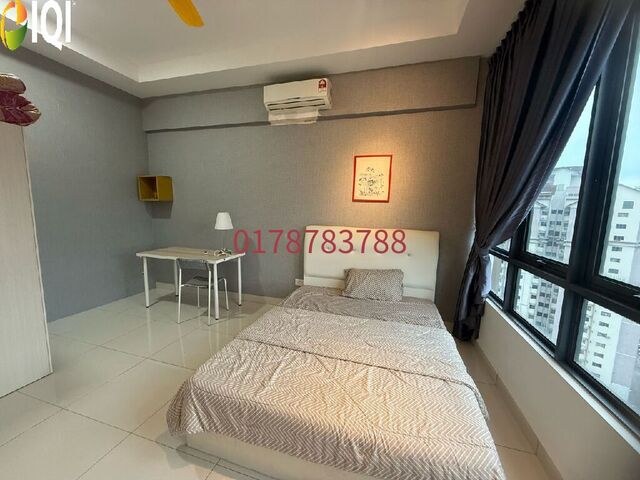
Botanika @ Tebrau Bay
Jalan Bayu Puteri 2, Taman Bayu Puteri
QAR 443,718
Listed on July 18, 2026
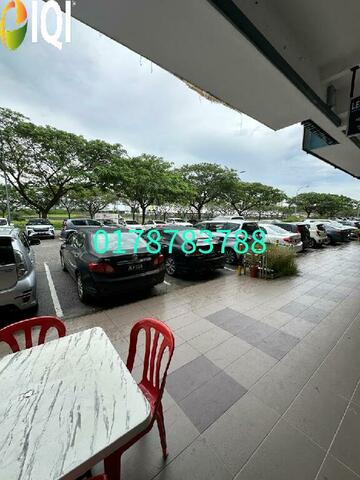
Bandar Dato Onn
Jalan Perjiranan 4/6
QAR 1,337
Listed on January 14, 2026
Our newly launched projects
Discover the real estate properties in and around Johor Bahru, Malaysia. Buy apartment units, landed houses, bungalows, commercial office space, shop lots, and sub-sales with 100% confidence at IQI Global.
 Large land area
Northern TechValley @BKE
Mukim 14, Kubang Semang, 14400 Seberang Perai, Penang, Malaysia
Starting from QAR 12,915,508
Listed on January 23, 2026
 Varied built-up sizes
Taman IKS Bukit Minyak
Jalan IKS Bukit Minyak Utama, Taman IKS Bukit Minyak, 14100 Simpang Ampat, Penang, Malaysia.
Starting from QAR 1,072,586
Listed on January 23, 2026
 Industrial project type
Regalway Industrial Hub (Industrial)
Regalway Industrial Hub, Off Jalan Bukit Panchor, Bukit Panchor, 14100 Simpang Ampat, Penang, Malaysia.
Starting from QAR 4,468,365
Listed on January 23, 2026
 Located in Bukit Mertajam
Taman Jasa Ria (Garden Villa)
Jalan Permatang Pasir, Taman Jasa Ria, 14000 Bukit Mertajam, Penang, Malaysia
Starting from QAR 996,851
Listed on January 23, 2026
 Larger built-up area
Taman Jasa Intan (Garden Superlink)
Jalan Jasa Intan, Taman Jasa Intan, 14000 Bukit Mertajam, Penang, Malaysia
Starting from QAR 728,838
Listed on January 23, 2026
 Located in Nibong Tebal
Taman Fajar Permai (Sunrise Terrace)
Jalan Fajar, Taman Fajar Permai, 14300 Nibong Tebal, Penang, Malaysia.
Starting from QAR 490,050
Listed on January 23, 2026
Mortgage Calculator
Calculate your estimated month repayment and plan your monthly expenses well.
The mortgage calculator is intended for reference only. Actual amount may vary.
Monthly Payment
Send me the mortgage calculator result

Home Loan Eligibility Calculator
Calculate your potential loan amount and assess your home buying affordability.

Rental Yield
Calculate the potential rental yield and evaluate a property's investment performance.

Down Payment Saving Plan
Create a structured savings plan and determine how much to save monthly for your down payment plan.

Malaysian Property Transaction Fees Calculator
Estimate the total transaction fees and budget accurately for your Malaysian property purchase.
IQI blog & news
Articles specifically curated for your daily digest of local and global real estate news.
Buying property in Malaysia is not complicated. It just feels that way because nobody hands you the full roadmap at the start. This guide does. It walks you through 8 steps from setting a budget to collecting your keys, plus the documents, fees, stamp duty and timeline you need to plan for. Whether it is your first home or your next one, start here. TL;DR Buying property in Malaysia follows 8 steps: research, affordability check, viewing, booking, loan comparison, legal process, key handover and cost planning. Banks usually finance up to 90% of the price for your first two homes, so plan for at least a 10% down payment. Budget another 10% to 15% on top for stamp duty, legal fees, valuation and moving-in costs. Most banks want your total monthly debts within roughly 60% to 70% of your income (your DSR). First-time Malaysian buyers pay no stamp duty on the transfer and loan agreement for homes up to RM500,000, until 31 December 2027. A subsale purchase usually takes 3 to 6 months from booking to keys. A new launch depends on the construction timeline. The 8 Steps to Buying Property in Malaysia at a GlanceTL;DRStep 1: Where Should You Buy?Step 2: How Much Can You Actually Afford?Step 3: What Should You Check During a Property Viewing?Step 4: How Do You Book a Property and What Documents Do You Need?Step 5: How Do You Choose the Right Home Loan?Step 6: What Happens During the Legal Process?Step 7: When Do You Get Your Keys?Step 8: What Costs Should You Budget For Beyond the Price?How Long Does Buying Property in Malaysia Take?Which Government Housing Schemes Can Help You Buy?What Legal Matters Should You Check Before Buying?What Mistakes Should You Avoid?Frequently Asked Questions Want the bigger picture first, including buyer types and the best areas to buy in 2026? Read our full guide on how to buy a house in Malaysia. Step 1: Where Should You Buy? Before you fall in love with a unit, work out what actually fits your lifestyle and long-term plans. Location and access: distance to work, peak-hour traffic, and MRT, LRT or KTM access. Price benchmarking: compare subsale and new launch prices, and check recent transaction prices nearby. Facilities and environment: security, amenities and how crowded the development feels. Future growth: upcoming developments, rental demand and infrastructure plans. Here is the honest truth: a cheap house in the wrong location can cost you more in time, stress and resale value. Step 2: How Much Can You Actually Afford? This is the make-or-break step. It decides what you can realistically buy, so do it before you view a single property. Banks look at three things: your income, your existing debts and the size of your down payment. Under Bank Negara Malaysia rules, you can usually borrow up to 90% of the price for your first two residential properties, and up to 70% from your third property onwards. How much can you borrow? Start here. The calculator below estimates your maximum loan amount based on your income and commitments. Will your DSR pass the bank's check? Your Debt Service Ratio (DSR) is the share of your income that goes to debt repayments. Most banks want your total commitments within roughly 60% to 70% of income. A high DSR is one of the most common reasons home loans get rejected. Learn how DSR works. What will your monthly instalment be? A safe rule of thumb is to keep your instalment within 30% to 40% of your monthly income. Try different interest rates and tenures below to see how the number moves. Estimates for guidance only. Actual figures depend on the bank's assessment, current rates, and your full financial profile. Not sure what your salary can stretch to? See how much home loan you can get with your salary. Numbers looking tight, or not sure how to read them? You don't have to figure this out alone. An IQI agent reviews your budget, shortlists homes you can actually afford, and walks you through every step from loan to keys. Free, and no pressure. Talk to a local IQI agent and buy with confidence Or browse now: subsale homes and new launches. Step 3: What Should You Check During a Property Viewing? Photos online can be flattering. A physical viewing confirms whether the property really matches the listing. Is the layout practical for how you actually live? Does the unit get natural light and airflow? How loud is it? Listen for highways, neighbours and nearby construction. What condition is the building in, including lifts, corridors and common areas? One tip that pays off: visit at different times of the day. A quiet Sunday morning can feel very different from a weekday evening rush. Step 4: How Do You Book a Property and What Documents Do You Need? Once you find the right unit, you secure it with a booking. The process differs for new projects and subsale homes. New projectSubsaleHow you bookFill in the developer's booking formSign a Letter of Offer to Purchase (OTP)What you payBooking fee, typically RM500 to RM5,000Earnest deposit, typically 2% to 3% of the priceNext stepLoan application, then SPA signingLoan application, then SPA signing and balance of the 10% deposit Speed matters here. Good units do not stay on the market for long, so have your documents ready before you view. Documents for salaried buyers MyKad (identity card) Latest 3 to 6 months' salary slips Latest EPF statement EA Form or Borang BE for the past 2 years Latest 3 to 6 months' bank statements Letter of employment, if requested Booking receipt or signed OTP (the bank will need the SPA later) Extra documents for self-employed buyers Business registration documents (SSM) Latest 6 months' company bank statements Borang B for the past 2 years No fixed payslip? Gig workers have options too. Ask an IQI agent which banks and schemes accept your income type. Step 5: How Do You Choose the Right Home Loan? Do not just take the first bank that says yes. Even a 0.1% difference in rate can save you thousands over a 30 to 35 year loan. Apply to at least 3 banks and compare: Interest rate and how it is calculated Lock-in period and early settlement penalty Flexi features, such as making extra payments and withdrawing them later Monthly instalment and total interest over the tenure Which loan type suits you? ChoiceOption AOption BRate typeFloating: moves with the OPR and the bank's base rateFixed: predictable instalments, usually for a set periodStructureConventional: interest-based loanIslamic: Shariah-compliant financing based on profit rateFlexibilityFlexi or semi-flexi: extra payments reduce interestTerm loan: simpler, often a slightly lower rate Compare the details in our guide to flexi, semi-flexi and fixed home loans, and check this month's latest house loan interest rates. What bank promotions should you look out for? Zero Moving Cost (ZMC) packages, where legal and valuation fees are covered or added to the loan Lower rates for first-time buyers Cashback offers Special Islamic home financing plans Read the fine print on ZMC. If the fees are financed into your loan, you still pay them, just with interest over time. Once you submit, loan approval usually takes about 1 to 2 weeks. The bank then issues a Letter of Offer with the approved amount, rate and terms. Step 6: What Happens During the Legal Process? After your loan is approved, the paperwork moves into the lawyers' hands. You will sign two key documents: Sale and Purchase Agreement (SPA) with the seller or developer Loan agreement with your bank Your lawyer then handles the title search, stamp duty, and the transfer of ownership through the Memorandum of Transfer (MOT). For a subsale, you normally top up your earnest deposit to 10% when signing the SPA. The bank then releases the balance within the completion period, which is usually 3 months, with a possible 1-month extension. Buying a new launch? Many developers now offer electronic signing. See how eSPA signing with iDsaya works. Step 7: When Do You Get Your Keys? This final milestone depends on the type of property you bought. Subsale: once the full payment is made and ownership is transferred, the seller hands over the keys. New project: you receive Vacant Possession (VP), inspect the unit for defects, and report any issues to the developer within the Defect Liability Period, generally 24 months for residential projects. Do not rush the inspection. A proper defect check now can save you costly repairs later. Step 8: What Costs Should You Budget For Beyond the Price? The down payment is only the start. Plan for costs before, during and after the purchase. Before buyingDuring the purchaseAfter getting keysBooking fee or earnest depositLegal fees for the SPA and loan agreementRenovation and furnitureDown payment (usually 10%)Stamp duty on the MOT and loan agreementMaintenance fee and sinking fund Valuation fee (roughly 0.25% of the price)Utility deposits and insurance (MRTA or MLTA, fire insurance) As a rule, keep a 10% to 15% buffer on top of your down payment. It stops a surprise bill from derailing the purchase. How much is stamp duty on property in Malaysia? Stamp duty on the Memorandum of Transfer (MOT) is tiered for Malaysian citizens and permanent residents: Property valueStamp duty rateFirst RM100,0001%RM100,001 to RM500,0002%RM500,001 to RM1,000,0003%Above RM1,000,0004% Worked example: on a RM500,000 home, MOT stamp duty is RM1,000 on the first RM100,000 plus RM8,000 on the next RM400,000, so RM9,000 in total. Stamp duty on the loan agreement is a further 0.5% of the loan amount, which is RM2,250 on a RM450,000 loan. Good news for first-time buyers: Malaysians buying their first home priced up to RM500,000 are exempt from stamp duty on both the MOT and the loan agreement until 31 December 2027. In the example above, that saves RM11,250. Foreign buyers pay a higher flat stamp duty rate and must also meet state minimum price thresholds and consent requirements, so check the latest rules with your lawyer before committing. How much are legal fees? Lawyers' fees for the SPA follow the Solicitors' Remuneration Order 2023: 1.25% on the first RM500,000 and 1% on the next RM7 million. On a RM500,000 home, that is RM6,250, plus disbursements and SST. The loan agreement carries a separate legal fee on a similar scale. Get a full estimate in seconds with our property transaction fees calculator, and see the hidden fees first-time buyers often miss. How long will it take to save your down payment? Plug in your target price and monthly savings to see when you will be ready. Estimates for guidance only. Actual figures depend on the bank's assessment, current rates, and your full financial profile. How Long Does Buying Property in Malaysia Take? StageTypical timeLoan approval1 to 2 weeksSPA signingWithin about 1 month of bookingStamping and loan documentation1 to 2 monthsKeys for a subsale (completed property)3 to 6 months from bookingKeys for a property under construction24 to 48 months, depending on the project Subsale gets you in faster, while a new launch gives you more time to save and stagger payments. Which Government Housing Schemes Can Help You Buy? If you are a first-time or lower-to-middle income buyer, these programmes can bring a home within reach: PR1MA: affordable homes for middle-income Malaysians. Read the PR1MA guide (BM). Residensi Wilayah (formerly RUMAWIP): affordable housing in the Federal Territories. See how to apply. Rent-to-Own (RTO): rent first, then buy the home later. Learn how RTO works. Skim Jaminan Kredit Perumahan (SJKP): a government guarantee that helps buyers without a fixed salary, such as gig workers, get a home loan. First-time buyer stamp duty exemption: full exemption on homes up to RM500,000 until 31 December 2027. Not sure which scheme fits you? Compare your options in our first-home schemes guide and the B40 and M40 housing schemes. What Legal Matters Should You Check Before Buying? Freehold or leasehold: leasehold land returns to the state when the lease ends, which affects financing and resale. Compare leasehold vs freehold. Strata or individual title: check whether the title has been issued, as it affects how ownership is transferred. Developer track record: look at past projects, delivery times and build quality. Bumiputera lots: some units are reserved under quota and carry resale restrictions. Always work with a qualified lawyer. Never skip due diligence, however good the deal looks. What Mistakes Should You Avoid? Paying a deposit before checking your loan eligibility Accepting the first loan offer without comparing banks Spending your whole budget on the down payment, with no buffer for fees Ignoring maintenance fees and sinking fund in your monthly budget Skipping the defect inspection on a new property Learn from people who have done it. Read what first-time homebuyers wish they knew and real first-home buyer stories. Planning to buy property and want it done right? Our IQI agents will help you sort the budget, the loan and the paperwork, so you can focus on finding the right home. Fill in your details below to get in touch. [custom_blog_form] Continue reading: How to Buy a House in Malaysia: The Complete 2026 Guide Latest House Loan Interest Rates Hidden Fees First-Home Buyers Should Know Leasehold vs Freehold Renting Forever or Buying a House? What First-Time Homebuyers Wish They Knew Frequently Asked Questions How much salary do I need to buy a house in Malaysia? Aim to keep your monthly instalment within 30% to 40% of your income. On a RM5,000 monthly income, that generally points to a property of around RM300,000 to RM450,000, depending on your other commitments. How much can I borrow for a home loan in Malaysia? It depends on your income, existing debts and DSR. Banks usually finance up to 90% of the price for your first two homes and want total repayments within roughly 60% to 70% of income. Use a loan eligibility calculator for an estimate. What is DSR and why does it matter? DSR (Debt Service Ratio) is the share of your income that goes to debt repayments. A high DSR is one of the most common reasons home loans get rejected. What is the minimum down payment for a house in Malaysia? Usually 10% of the property price for your first two homes. You also need to budget for legal fees, stamp duty and other costs, so plan for a 10% to 15% buffer on top. Do first-time buyers pay stamp duty in Malaysia? Malaysian first-time buyers of a home priced up to RM500,000 are exempt from stamp duty on the MOT and the loan agreement until 31 December 2027.

Forty. That is how many British MM2H participants had bought homes in Malaysia by the end of 2025, making the UK first in Europe. No other European country made the top 10. Out of 744 completed MM2H home purchases, China accounted for 304 and Britain for 40, according to parliamentary figures reported by Malay Mail. The latest figures show a similar pattern. Malaysia received 7,650 MM2H applications between October 2024 and August 2026, yet European countries remain largely absent from the leading markets. Malaysia offers warm weather, lower living costs and an attractive retirement lifestyle. But with Portugal, Spain, Greece and Italy much closer to home So, what makes Malaysia worth the 13-hour flight? Here is what Europeans actually gain from living in Malaysia under MM2H. Key Takeaways Europeans can apply for MM2H through a MOTAC-licensed operator. Kuala Lumpur costs less than London, Paris and Lisbon, based on Expatistan's September 2026 data. Silver MM2H starts at USD150,000, plus a home worth at least RM600,000, for a renewable 5-year pass. Foreign buyers pay 8% stamp duty, and state property price floors may exceed MM2H requirements. Applicants aged 50+ have no minimum stay requirement, offering greater flexibility for European retirees. MM2H does not offer PR or citizenship, while employment and business activity are limited to Platinum. Table of contentsMM2H Europe in 60 seconds: can Europeans apply?How much cheaper is Kuala Lumpur than European cities?Why choose Malaysia over Spain or Portugal?How much does MM2H cost a European?What is daily life like for Europeans in Malaysia?What this means for you: 5 checks before you applySo, is living in Malaysia better than Europe?Frequently Asked Question (FAQs) MM2H Europe in 60 seconds: can Europeans apply? Quick answer: Yes. Malaysia My Second Home (MM2H) is open to Europeans who meet its age and financial requirements, applying through a MOTAC-licensed operator. It grants a renewable long-term pass of 5 to 20 years, depending on tier, with multiple-entry rights, but no work rights outside Platinum and no route to citizenship. Europe isn't new to MM2H either. Britain has long been one of the programme's most reliable source markets. The other top nations for MM2H applicants, after China and Australia, are South Korea, Japan, Bangladesh, and the United Kingdom. Kashif Ansari, Co-Founder and Group CEO, Juwai IQIBernama, 11 March 2025 If you are new to the programme, our MM2H eligibility and application guide covers the basics. Here, the question is narrower: how does Malaysia stack up against the places Europeans actually consider? What matters to youMalaysia under MM2HSouthern Europe (Spain, Portugal, Greece)Day-to-day living costsClear advantageHigher, even in LisbonHousing value per euroClear advantagePremium in major citiesYear-round warm weatherClear advantage, roughly 25°C to 35°CSeasonal, cool wintersDistance from familyAbout 13 hours by airClear advantage, 2 to 4 hoursResidence rights, EU citizensMM2H, 5 to 20 years renewableClear advantage, free movementResidence rights, UK citizensClear advantage, no minimum stay from age 5090 days in any 180 without a national visaEnglish in daily lifeClear advantage, widely usedVaries by country and regionAccess to AsiaClear advantageLong-haulPublic healthcare accessPrivate, insurance neededClear advantage for EU citizensForeign buyer entry costWeaker, 8% stamp duty since 2026Clear advantage, EU buyers treated like locals IQI comparison, October 2026. Climate range from International Living; residence and stamp duty rules from MOTAC, KPMG and Schengen Borders Code. The pattern is clear. Malaysia wins on cost, climate and lifestyle value. Europe wins on proximity, healthcare rights and ease of entry. How much cheaper is Kuala Lumpur than European cities? Treating "Europe" as one price point is where most MM2H articles go wrong. Moving from London is a completely different calculation from moving from Lisbon. So we compared Kuala Lumpur against five European cities using the same dataset. European cityKL cheaper overallKL housing cheaperData updatedLondon68%70%30 Sept 2026Amsterdam56%65%30 Sept 2026Paris55%62%30 Sept 2026Berlin48%57%16 July 2026Lisbon35%49%30 Sept 2026 Source: Expatistan city comparisons. IQI converted Expatistan's "X% more expensive than KL" into "KL is X% cheaper". Expatistan flags these comparisons as still gathering data, so treat as indicative. Even Lisbon, Europe's favourite budget retirement city, costs about 55% more than Kuala Lumpur for the same lifestyle. Where the gap actually shows up Housing, transport and medical visits drive most of the difference. Here is what a month looks like, converted to ringgit. Monthly itemKuala LumpurLondonParisLisbonRent, 900 sq ft furnished, normal areaRM2,485RM15,369RM13,908RM7,139Rent, 900 sq ft furnished, prime areaRM5,259RM16,309RM15,494RM10,264Utilities, two peopleRM234RM1,129RM1,066RM946Monthly public transport passRM60RM1,118RM413RM176Short private doctor visitRM106RM367RM153RM348 Source: Expatistan, prices updated 30 September 2026. Converted at RM5.402 per pound and RM4.636 per euro, the rates Expatistan used. A normal-area flat in London costs six times its Kuala Lumpur equivalent. In Lisbon, it is still nearly three times. Where the gap disappears Not everything is cheaper. A gym membership in Kuala Lumpur averages RM236 a month, more than Paris (about RM148) or Lisbon (about RM176). Home internet costs roughly the same as in Paris. Imported wine, cheese and European brands carry duties that make them pricier than back home. The rule of thumb: live locally and Malaysia is remarkably affordable. Recreate your European shopping basket, and the savings shrink. The Europe to Kuala Lumpur lifestyle calculator Using Expatistan's equivalence for each city pair, here is what a comparable lifestyle costs in Kuala Lumpur. If you spend this a month inComparable KL lifestyleMonthly differenceOver a yearLondon, £4,500about RM7,690 (£1,420)about RM16,620about RM199,500 (£36,900)Amsterdam, €5,000about RM10,160 (€2,190)about RM13,020about RM156,200 (€33,700)Paris, €5,000about RM10,480 (€2,260)about RM12,700about RM152,400 (€32,900)Berlin, €4,500about RM10,820 (€2,330)about RM10,110about RM121,300 (€26,100)Lisbon, €3,500about RM10,470 (€2,260)about RM5,760about RM69,100 (€14,900) IQI calculation, October 2026. Derived from Expatistan's stated cost-of-living equivalence for each city pair and the exchange rate shown on that comparison. Indicative only; your own spending pattern will differ. Outside the capital, budgets stretch further. International Living estimates a retiree in Penang can live comfortably on about US$2,200 a month. Why choose Malaysia over Spain or Portugal? This is the comparison that matters. International Living's 2026 index places Greece first, Portugal fourth, Italy sixth, France seventh and Spain eighth. Malaysia is 10th. Southern Europe has the home advantage. But the gap has narrowed in three ways. 1. Southern Europe isn't the bargain it used to be Lisbon housing is now about twice the price of comparable Kuala Lumpur housing. Spain closed its golden visa in April 2025, and Portugal's NHR tax regime closed to most new applicants in 2024. The "cheap sunny corner of Europe" is getting harder to find, especially in the cities retirees prefer. 2. For British retirees, Brexit changed the maths Since leaving the EU, UK citizens can spend only 90 days in any 180 in the Schengen area without a national visa. That cuts a winter in the Algarve short. MM2H works differently. Participants aged 50 and above have no minimum stay requirement at all, and passes run 5 to 20 years, renewable. You can split your year between Britain and Malaysia without counting days. 3. Winter becomes optional, and Asia becomes next door Malaysia stays roughly 25°C to 35°C all year. No heating bills, no grey February. Kuala Lumpur also puts Bangkok, Bali, Singapore and Ho Chi Minh City within short-haul reach. Malaysia Airlines flies twice daily to London Heathrow and returned to Paris with daily flights in March 2025. The honest trade-offs Distance. About 13 hours nonstop, and Kuala Lumpur is 6 to 8 hours ahead of Europe. Family emergencies and grandchildren's birthdays are harder. Healthcare rights. EU social security cover and the UK GHIC do not apply in Malaysia. You will need private insurance. Pensions. The UK State Pension is frozen for residents of Malaysia. More on this below. Climate. Heat and humidity are constant, with heavy monsoon rain on parts of the coast late in the year. If you are weighing Malaysia against another long-haul option, our MM2H UAE comparison with Dubai runs the same analysis for Gulf residents. How much does MM2H cost a European? MM2H is not a cheap retirement visa. It is a financial commitment that locks money into Malaysia, and that is by design. MM2H tierFixed depositPass termMinimum home priceIn euros (approx.)Participating feeSilverUSD150,0005 years, renewableRM600,000€129,400RM1,000GoldUSD500,00015 years, renewableRM1,000,000€215,700RM3,000PlatinumUSD1,000,00020 years, renewableRM2,000,000€431,400RM200,000SEZ/SFZ, age 21 to 49USD65,00010 years, renewableSet by Forest City developmentVariesRM1,000SEZ/SFZ, age 50+USD32,00010 years, renewableSet by Forest City developmentVariesRM1,000 Source: MOTAC, mm2h.gov.my category pages, checked 1 October 2026. Euro figures converted at RM4.636 per euro. Processing fee RM5,000 per principal and RM2,500 per dependant. Pass fee RM500 a year. Silver, Gold and Platinum applicants must be at least 25. SEZ/SFZ starts at 21, but the property must be in Forest City, Johor. After approval, you can withdraw up to 50% of the fixed deposit for buying your home, education, medical costs or tourism. Many participants use it to fund the property purchase. For the full tier-by-tier breakdown, see MM2H explained: Silver, Gold, Platinum and SEZ requirements. The two property costs nobody puts in the brochure First, stamp duty. Since 1 January 2026, non-citizens pay a flat 8% on residential property transfers. MM2H participants get no exemption. Purchase priceMalaysian citizenForeign buyer from 2026Foreign buyer in eurosRM600,000 (Silver minimum)about RM12,000RM48,000about €10,350RM1,000,000 (Gold minimum)about RM24,000RM80,000about €17,260RM2,000,000 (Platinum minimum)about RM64,000RM160,000about €34,510 Source: KPMG Malaysia, Budget 2026 tax highlights. Citizen figures use the standard 1% to 4% scale. Permanent residents are excluded from the 8% rate. Second, state price floors. Each state sets its own minimum price for foreign buyers, and it often sits above the MM2H minimum. StateMinimum price for foreign buyersKuala LumpurRM1 millionSelangorRM2 millionPenangRM750,000 to RM1.8 million, by location and typeJohorRM1 million to RM2 million, by locationSarawakRM500,000 to RM600,000, by location Source: IQI, foreign home ownership rules in Malaysia, updated January 2026. State rules change; confirm before you commit. In practice, a Silver participant buying in Kuala Lumpur needs a home worth at least RM1 million, not RM600,000. That means about RM80,000 in stamp duty alone, before legal fees. Run your full numbers with IQI's property transaction fees calculator. And remember the lock-in: you cannot sell the home for 10 years, unless you are upgrading to a higher-value one. Which MM2H tier suits a European? Your situationTier worth looking atWhyRetiring, 50+, want flexibilitySilverLowest mainland entry, no minimum stay from age 50Want a longer horizon without renewalsGold15-year term, though employment is still not allowedPlan to work or run a business in MalaysiaPlatinumThe only tier where career and business are permittedLower deposit, happy to live in JohorSEZ/SFZFrom USD32,000, but the home must be in Forest City IQI summary of MOTAC rules. Not advice; confirm your tier with a licensed MM2H operator. Buying as a foreigner for the first time? See which properties foreigners can own, and the price floors in each state. Read the foreign ownership guide → What is daily life like for Europeans in Malaysia? Cost and visas get you through the door. Daily life decides whether you stay. Healthcare: private, modern and affordable, but insure it A short private doctor visit in Kuala Lumpur averages RM106. The same visit costs about RM367 in London and RM348 in Lisbon on Expatistan's data. In Penang, International Living reports specialist consultations typically between US$21 and US$53, at well-equipped private hospitals such as Island, Gleneagles and Adventist. MM2H permits long-term medical treatment in Malaysia. But affordable is not the same as free. Budget for international health insurance, because European public cover will not follow you. Family: you don't have to move alone MM2H lets you bring a spouse, children under 21, and unmarried, unemployed children aged 21 to 34. Medically certified children with disabilities have no age limit. Parents and parents-in-law can join too. Dependant children may study up to tertiary level at government-recognised institutions, and Platinum participants may also bring a foreign maid Where Europeans tend to settle Kuala Lumpur: city living, international schools, private hospitals and the best flight links. Penang: heritage, food and a slower pace. International Living's pick for retirees. See the best areas for retirees and expats in Penang. Johor: next to Singapore, and home to the Forest City SEZ/SFZ tier. Langkawi, Sabah and Sarawak: islands, rainforest and diving. Note that Sarawak runs its own S-MM2H programme with separate rules. Demand is building across these locations, even if Europeans are a small share of it. A further 2,637 MM2H participants are still in the process of purchasing homes, including finalising sale and purchase agreements and identifying suitable home locations. Datuk Seri Tiong King Sing, Minister of Tourism, Arts and CultureMalay Mail, 4 February 2026 What this means for you: 5 checks before you apply Malaysia can offer Europeans an excellent second life. But MM2H rewards preparation. Run these five checks first. 1. Your tax position, on both ends Malaysia exempts foreign-sourced income for resident individuals until 31 December 2036, but the exemption covers income already taxed in the country where it was earned. Partnership business income is excluded. Your home country's rules matter just as much. Get cross-border tax advice before you move, not after your first assessment. 2. Your pension The UK only increases the State Pension abroad where a reciprocal agreement exists. Malaysia has none, so a British pension is frozen at the rate paid when you leave. Over a 20-year retirement, that matters. EU pensioners should check their own scheme's rules on payments outside the EU. 3. Your healthcare cover Arrange international health insurance that covers Malaysia before you relocate. Pre-existing conditions and age limits vary widely between insurers. 4. Your property, and where you'll really live Because the home is compulsory and locked for 10 years, choose a place you would happily live in, not just one that clears the MM2H threshold. 5. What MM2H is, and isn't MM2H is a long-term visa. It is not an immigration shortcut. MM2H has never offered citizenship or permanent resident status. Datuk Seri Tiong King Sing, Minister of Tourism, Arts and Culture So, is living in Malaysia better than Europe? The short answer: it depends on what you want your money to do. For Europeans who want more lifestyle per euro or pound, year-round warmth and long-term residence without counting days, Malaysia beats most of Europe, Lisbon included. For those who put family proximity and EU healthcare rights first, Southern Europe still wins. Use this to find your side of the line. Malaysia under MM2H is likely the better fit if...Southern Europe is likely the better fit if...You are 50 or over and want to split the year between Europe and Asia without counting daysYou want to see children and grandchildren often, and at short noticeYou are leaving a high-cost city such as London, Paris or AmsterdamYou already live somewhere with modest living costsYou can set aside a USD150,000 deposit and buy a home of RM600,000 to RM1 million or moreYou would rather not lock capital into a deposit and a home for 10 yearsYou want year-round warmth and easy travel across AsiaYou rely on EU public healthcare or pension upratingYou do not need to work locally, or you qualify for PlatinumYou plan to work or start a business without major capital IQI summary, October 2026. Based on MOTAC MM2H rules, Expatistan cost data and the checks above. The numbers behind the verdict are simple. Kuala Lumpur costs about 68% less than London and 35% less than Lisbon. Entry starts at a USD150,000 deposit plus a home, foreign buyers pay 8% stamp duty, and MM2H never leads to permanent residency. Malaysia knows what the programme is worth, and wants more of these buyers. The programme has successfully brought in billions of ringgit into the country in a short period of time and has benefitted many sectors of our economy Chiew Choon Man, Deputy Minister of Tourism, Arts and Culture So the better question for Europeans isn't "Is Malaysia cheaper?" It is: what kind of life could your existing savings buy here? For many, the answer is a noticeably bigger one. Frequently Asked Question (FAQs) Can European citizens apply for MM2H? Yes. MM2H is open to eligible foreign nationals from countries with diplomatic relations with Malaysia, which includes the UK and EU member states. Applications must go through an MM2H operator licensed by the Ministry of Tourism, Arts and Culture (MOTAC). How much cheaper is Kuala Lumpur than London or Paris? On Expatistan data updated 30 September 2026, Kuala Lumpur is about 68% cheaper than London and 55% cheaper than Paris overall. Housing is about 70% and 62% cheaper respectively. Even Lisbon is about 55% more expensive than Kuala Lumpur. What is the minimum money needed for MM2H? Silver, the main entry tier, needs a USD150,000 fixed deposit and a home worth at least RM600,000 (about 129,400 euros). The SEZ/SFZ tier starts from USD32,000 for applicants aged 50 and above, but the home must be in Forest City, Johor. State price floors for foreigners, such as RM1 million in Kuala Lumpur, can raise the real minimum. Do European retirees have to live in Malaysia for 90 days a year? No, not if they are 50 or older. MM2H participants aged 50 and above have no minimum stay requirement. Participants aged 25 to 49 must spend 90 cumulative days a year in Malaysia, which the principal and dependants can share. Do foreigners pay higher stamp duty in Malaysia? Yes. Since 1 January 2026, non-citizens pay a flat 8% stamp duty on residential property transfers, with no exemption for MM2H participants. On a RM1 million home, that is RM80,000, compared with about RM24,000 for a Malaysian citizen. Can I work in Malaysia under MM2H? Only under the Platinum tier, where career and business activities are permitted. Silver, Gold and SEZ/SFZ participants are not allowed to take up employment or run a business in Malaysia. Does MM2H lead to permanent residency or citizenship? No. MM2H is a long-term renewable social visit pass. Tourism Minister Datuk Seri Tiong King Sing told Parliament in February 2026 that MM2H has never offered citizenship or permanent resident status. Is my European pension taxed in Malaysia? Malaysia exempts foreign-sourced income received by resident individuals until 31 December 2036, provided the income has been taxed in the source country. Rules in your home country also apply, so take professional cross-border tax advice. British retirees should note the UK State Pension is frozen for residents of Malaysia. Which Malaysian city suits European retirees best? Penang suits retirees who want heritage, food and a slower pace, and is International Living's highlighted retirement spot in Malaysia. Kuala Lumpur offers the best healthcare, schools and flight links. Johor suits those who want to be near Singapore. Make Your Move to Malaysia Count. Your MM2H application starts with a licensed operator. Your new home starts with IQI. Share your tier, budget and preferred city, and let a local IQI agent find the right fit. [custom_blog_form] Continue Reading: MM2H UAE: Is Living in Malaysia Better Than Dubai in 2026? MM2H China: Are Chinese Buyers Taking Over Malaysian Property? MM2H Explained: Why Malaysia Is a Safe Haven for Property Investors in 2026 Retire in Malaysia: #1 in Asia for American Retirees Sources MOTAC, MM2H category overview MOTAC, MM2H guidelines Malay Mail, 4 February 2026 Bernama, MM2H draws 7,650 applications, 26 September 2026 Bernama, Reformed MM2H programme boosts economy, 11 March 2025 ExpatGo, 5 February 2026 International Living, 2026 Annual Global Retirement Index Expatistan, Kuala Lumpur vs London (also Paris, Amsterdam, Berlin, Lisbon) KPMG Malaysia, Budget 2026 stamp duty The Edge Malaysia, foreign-sourced income exemption extended to 2036 House of Commons Library, Frozen overseas pensions Flightradar24, Malaysia Airlines returns to Paris, March 2025 Global Citizen Solutions, Spain golden visa ended April 2025

Version: BM Some career decisions are not made in meeting rooms. They are made quietly. Late at night.Between doubts.Between “what if” and “what now”. If you have ever searched “how to become a real estate agent in Malaysia”, chances are you are not just curious. You are considering change! Before you step into a real estate agent career in Malaysia, there is one story you should hear. View this post on Instagram A post shared by IQI (@iqiglobal) Table of contentsWhy Real Estate Remains an Open Opportunity in MalaysiaThe Challenges Many Faces in Career TransitionsFrom Journalism to Real Estate Success: The Story of MarieJualKondo (Natasha Gideon)What Natasha’s Journey Teaches About Career ReinventionWhat It Actually Takes to Succeed as a Real Estate Agent in MalaysiaHow to Start a Real Estate Career in Malaysia Why Real Estate Remains an Open Opportunity in Malaysia Unlike professions that demand specific degrees or years of industry certification, becoming a real estate agent in Malaysia follows a structured yet accessible pathway. You do not need a property-related academic background. You need: Registration under a licensed real estate agency Official Real Estate Negotiator status Required training Commitment Malaysia’s property market continues to generate transactions across residential, subsale and investment segments. As long as people buy, sell and upgrade homes, agents remain relevant. Real estate is not limited by corporate hierarchy. Income is performance-based. For many, that is both the attraction and the fear. The Challenges Many Faces in Career Transitions Changing careers is rarely comfortable. The biggest challenge is not learning something new. It is leaving something familiar. Fixed salaries provide stability. Commission-based careers provide possibility. But possibility comes with uncertainty. New agents often struggle with: Irregular income in early months Rejection from prospects Doubt from friends or family Self-doubt The first year is less about talent and more about resilience. Those who stay consistent build momentum. Those expecting quick results often leave too early. From Journalism to Real Estate Success: The Story of MarieJualKondo (Natasha Gideon) Before becoming a recognised real estate agent in Malaysia, MarieJualKondo or Natasha Gideon was a journalist covering the property industry. Through interviews with developers and negotiators, she observed how successful agents built their careers. Over time, she realised that long-term success in a real estate agent career in Malaysia was not about being the loudest — it was about discipline, follow-up and consistency. Eventually, she made a decision that many consider but few execute. She left a fixed salary to enter commission-based real estate. @natashagideon This page started in 2019 and I’ve been posting a lot since then. Here’s just a reminder of who I am and what I do #hartanahmalaysia #realestate #realestatejourney #teammjk #mariejualkondo ♬ original sound - MarieJualKondo The early months were challenging. There were viewings that did not convert and periods without commission. Instead of losing confidence, she focused on professionalism and structured follow-up. Within three weeks of handling one of her early subsale cases, she secured the deal! @natashagideon Thanks for having me @HITZ. What a blast with @Keanu Azman and my twin @ili ♬ original sound - songs n lyrics Nine years later, Natasha is now a team leader within IQI. Her journey was not built on luck, but on consistency, resilience and operating within a structured real estate platform. What Natasha’s Journey Teaches About Career Reinvention Her story reveals several truths about becoming a real estate agent in Malaysia. First, background does not determine success. She transitioned from journalism into property sales. Second, the early stage is emotionally demanding. Not because the industry is unfair, but because momentum takes time. Third, consistency compounds. Natasha did not rely solely on transactions. She began sharing educational property content under the name 'MarieJualKondo' long before digital branding became common among agents. I’m motivated by challenges. I’ve always understood the income potential that comes with being a REN and real estate negotiator, and I genuinely enjoy building my earnings! In a 9-to-5 job, even if you give 200 percent effort, your salary stays the same. But in real estate, when I put in 200 percent effort, my income can grow just as fast! Natasha Gideon There was no viral breakthrough. There was repetition, structured explanations and steady content creation. Over time, credibility accumulated, media recognition followed and leadership opportunities expanded. Career reinvention, especially in real estate, is rarely dramatic. It is disciplined and cumulative. What It Actually Takes to Succeed as a Real Estate Agent in Malaysia A sustainable real estate agent career in Malaysia depends on behavioural consistency. It rewards daily prospecting, systematic follow-ups, relationship management and emotional regulation during rejection. It does not reward impatience. Success during the first year often depends on three factors: surviving income fluctuations, committing to daily outreach activity and choosing structured mentorship. Operating under an established agency such as IQI provides compliance support, training systems, brand credibility and access to experienced leaders. While structure does not eliminate effort, it significantly reduces confusion and accelerates early learning. How to Start a Real Estate Career in Malaysia If you are serious about becoming a real estate agent in Malaysia, the pathway is clear: Join a licensed real estate agency Register as a Real Estate Negotiator Complete required training Operate under supervision The mechanics are straightforward. The mindset is the real decision. Is This the Right Path for You? Ask yourself honestly: Can you operate without guaranteed income initially? Are you willing to stay consistent even when results are delayed? Do you want growth without ceiling? Real estate in Malaysia remains one of the few industries where effort directly impacts income trajectory. Natasha once wrote about Malaysia’s property market. Today, she shapes it. The opportunity remains open. The real question is whether you are prepared to commit to it. At IQI, we provide the platform, training and mentorship to help you grow faster. Join Natasha’s team and build your real estate career in an environment designed for performance, progression and real results. [custom_blog_recruit_form] Continue Reading: What are the Benefits of Joining IQI Global as a Real Estate Agent? From Engineer to Top-Selling Real Estate Agent: How One Failure Can Bring You Closer to Years of Success Are You a -P or -J MBTI Personality Type? Unleash Your Hidden Talent as a Real Estate Agent Based On Your Type!

Malaysia is one of the few countries in Southeast Asia where foreigners can own property on a freehold title. But there is no single national rulebook. Each state sets its own minimum price, property types and approval process. This guide breaks it all down, state by state, for 2026. TL;DR: Foreign Property Ownership in Malaysia (2026)1. Yes, foreigners can buy property in Malaysia, including freehold, but need State Authority consent.2. Minimum prices are set by each state, usually from RM1,000,000 (KL, Putrajaya, Labuan, Johor strata, Penang Island strata).3. Selangor is generally RM2,000,000 in Zones 1 and 2. Melaka and Sarawak can start from RM500,000.4. Foreigners cannot buy Malay Reserved Land, low and medium-cost housing, or Bumiputera-quota units.5. Foreign buyers pay a flat 4% stamp duty on the transfer, plus legal fees and State consent fees.6. RPGT for foreigners is 30% if sold within 5 years and 10% from year 6 onwards. Can Foreigners Buy Property in Malaysia? Yes. Foreigners are generally allowed to purchase property in Malaysia. However, eligibility, minimum purchase prices and approval procedures vary by state. That is because land matters fall under state jurisdiction. The National Land Code 1965 requires foreign individuals and companies to obtain approval from the relevant State Authority before acquiring land or property. Property typeCan foreigners buy?Condominiums and serviced residencesYes, above the state minimum priceCommercial properties (shops, offices)Yes, subject to state requirementsIndustrial unitsYes, subject to state requirementsLanded homesSometimes, with tighter conditions and higher thresholdsAgricultural landGenerally restrictedMalay Reserved LandNoLow and medium-cost housingNoBumiputera-quota unitsNo Landed homes are the grey area. In Selangor, for example, foreigners can usually only buy landed homes that come with a strata title, such as units in gated and guarded communities. What Is the Minimum Price for Foreigners to Buy Property in Malaysia? (2026) Here are the indicative minimum purchase prices by state. Always check the latest figure with the State Authority before you commit, as thresholds are reviewed from time to time. StateStrata (condo, serviced residence)LandedKuala Lumpur, Putrajaya, LabuanFrom RM1,000,000From RM1,000,000SelangorRM2,000,000 in Zones 1 and 2. Zone 3 ranges from RM1,000,000 to RM2,000,000Penang IslandFrom RM1,000,000From RM3,000,000JohorFrom RM1,000,000From RM2,000,000MelakaMay start from RM500,000, depending on property categorySarawakMay start from RM500,000, depending on location and property category Figures are indicative as of 2026 and subject to change by each State Authority. Which State Is Cheapest for Foreign Buyers? Melaka and Sarawak have the lowest entry points, with some categories starting from RM500,000. Selangor is the most expensive, at RM2,000,000 in its prime zones. Johor stays popular with Singaporeans thanks to its RM1,000,000 strata threshold and the RTS Link to Singapore. How Do Foreigners Buy Property in Malaysia? 5 Steps The process is close to what locals go through, with one extra layer: State consent. Here is how it usually works. Step 1: Identify a Suitable Property Shortlist properties that are open to foreign ownership and meet the minimum price for that state. Avoid Bumiputera-quota units, which foreigners cannot buy. Step 2: Make an Offer and Pay the Earnest Deposit Sign a letter of offer or expression of interest and pay an earnest deposit, commonly around 2% to 3% of the price. Step 3: Sign the Sale and Purchase Agreement (SPA) The SPA is usually signed within the agreed timeframe. You top up the payment to complete the down payment, often 10% of the purchase price. Step 4: Obtain State Authority Approval Foreign buyers need consent from the relevant State Authority. Your lawyer normally handles this application as part of the transaction, including the forms, consent fee and supporting documents. Step 5: Arrange Financing and Complete the Purchase Foreigners can apply for a Malaysian home loan, but the financing margin is often lower than for locals. Once financing and approvals are in place, the balance is paid according to the SPA completion timeline. Tip: get your lawyer and banker on board early. State consent and loan approval can run in parallel and save weeks. What Taxes and Costs Do Foreigners Pay When Buying Property in Malaysia? The price tag is not the full bill. Budget for these extra costs on top of the purchase price. CostWhat foreign buyers should expectStamp duty (transfer)Flat 4% of the property value for foreign buyersLegal feesBased on the purchase price and the legal fee scaleState consent feeVaries by stateLoan stamp duty and legal feesOnly if you take a home loanRPGT (when you sell)30% within 5 years, 10% from year 6 onwards Worked Example: A RM1.2 Million Condo in Kuala Lumpur Earnest deposit (3%): RM36,000 Top-up to 10% at SPA: RM84,000 Stamp duty on transfer (4%): RM48,000 Balance via loan or cash: RM1,080,000 That means you need roughly RM168,000 in cash before legal fees, just to get to SPA and transfer. Plan for it early. Want the full breakdown? Use our property transaction fees calculator to estimate legal fees and stamp duty. Is There a Visa That Supports Foreign Property Buyers? Owning property in Malaysia does not give you residency on its own. But the Malaysia My Second Home (MM2H) programme pairs well with property investment. MM2H offers a renewable visa of 5 to 20 years, depending on the tier. Applicants must meet financial criteria such as fixed deposits and income requirements, and property purchases can count towards the programme. As of 2024, the revamped MM2H generated RM455.8 million through fixed deposits and property purchases, with 782 approvals granted. Example: A Singaporean Buyer in Johor Bahru Picture a Singaporean buyer looking at a condo in Johor Bahru. They pick a unit above Johor's RM1,000,000 strata threshold, outside the Bumiputera quota. Their lawyer files for State consent while the bank processes the loan. The result: a weekend home that can also earn rental income, thanks to JB's proximity to Singapore. The lesson is simple. Know the state rules first, and the rest of the process falls into place. https://youtu.be/GYvewvT7lJ8?si=hYjSnu49bIO8cvtm Key Takeaways1. Foreigners can buy property in Malaysia, with State Authority consent.2. Minimum prices differ by state, from RM500,000 (Melaka, Sarawak) to RM2,000,000 (Selangor Zones 1 and 2) and RM3,000,000 (Penang Island landed).3. Malay Reserved Land, low and medium-cost homes and Bumiputera units are off-limits.4. Budget for a 4% stamp duty, legal fees and State consent fees on top of the price.5. RPGT for foreigners is 30% within 5 years, so plan to hold long term. Frequently Asked Questions Thinking of buying in Malaysia? Chat with our professional team, a group dedicated to ensuring your purchase journey goes smoothly. Can foreigners buy land in Malaysia? Yes, but with State Authority approval. Foreigners cannot buy Malay Reserved Land or, in most states, agricultural land. What is the minimum price for foreigners to buy property in Kuala Lumpur? RM1,000,000 in Kuala Lumpur, Putrajaya and Labuan. Can foreigners buy landed property in Malaysia? Sometimes. Landed homes face tighter conditions and higher thresholds, such as RM2,000,000 in Johor and RM3,000,000 on Penang Island. Selangor generally only allows landed strata-titled homes. Can foreigners get a home loan in Malaysia? Yes. Malaysian banks lend to foreigners, but the financing margin is usually lower than for locals. How much stamp duty do foreigners pay in Malaysia? Foreign buyers pay a flat 4% stamp duty on the property transfer. Does buying property in Malaysia give me residency? No. Property ownership does not grant residency. Programmes like MM2H offer long-term visas separately. Conclusion Malaysia is open to foreign buyers, but the rules change at every state border. Check the minimum price, avoid restricted categories and budget for stamp duty and fees. As regulations and thresholds can change, confirm the latest requirements with a qualified property professional or lawyer before proceeding. Do you wish to talk to experts before making that big purchase? Chat with our professional team, a group dedicated to ensuring your purchase journey goes smoothly! [custom_blog_form]
Ready to get started?
Get in touch now.