

Team Leader ∙ Dreammakerz
Alan Tan
PEA3780
Team Leader ∙ Dreammakerz
Alan Tan
PEA3780
About Alan Tan
Leveraging market knowledge and negotiation skills to deliver exceptional results. Your real estate success is my priority. Ready to make your real estate dreams a reality? Let's chat. Your dream home awaits.
1 year at IQI
54 transactions
54 properties on sale
26 properties on rent
Contact Alan Tan
Alan Tan Social Links
Alan Tan's Service Locations
Alan Tan's Service Locations
My Listings
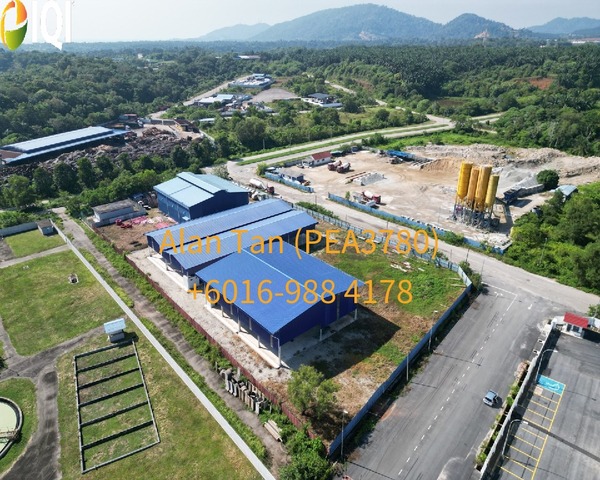
BANDAR DAMANSARA KUANTAN
Damansara Industrial Area, Kuantan
Rp 108,964,305 /month
Listed on March 17, 2026

Galing / Air Putih, Kuantan (NEW HOUSE)
Galing / Air Putih @ Kuantan
Rp 2,963,829,096
Listed on February 13, 2025
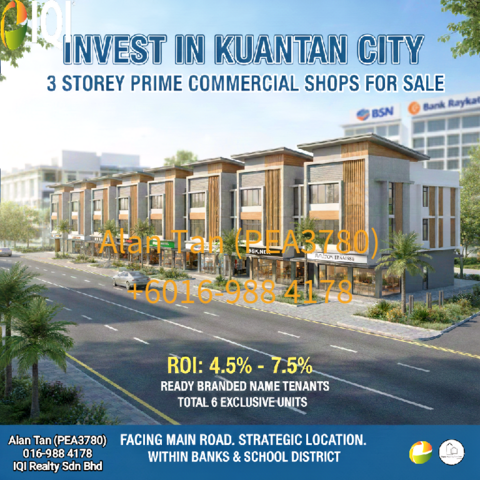
Indera Mahkota
Great ROI Investment! WITH READY TENANT! Kuantan city
Rp 3,748,372,092
Listed on December 6, 2025
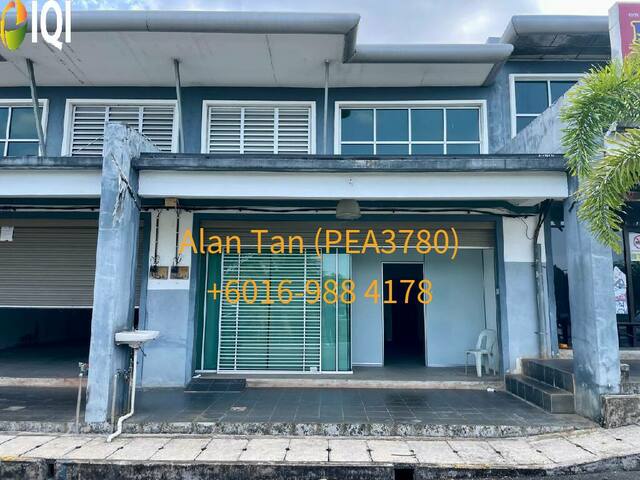
Indera Mahkota
INDERA MAHKOTA
Rp 8,717,144 /month
Listed on May 6, 2026
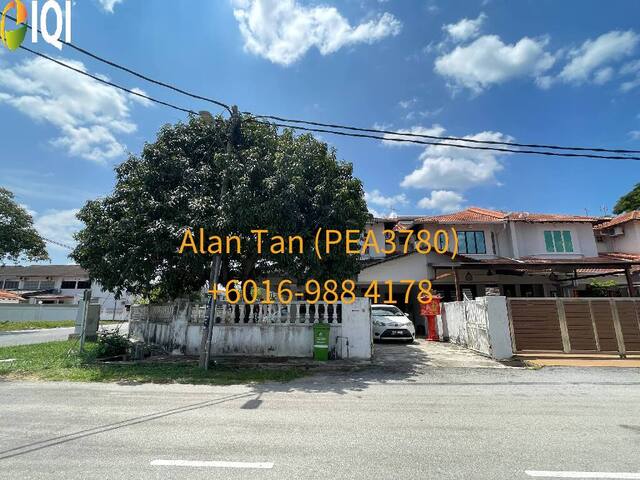
KUBANG BUAYA, KUANTAN
KUBANG BUAYA, KUANTAN
Rp 3,138,171,984
Listed on August 5, 2026
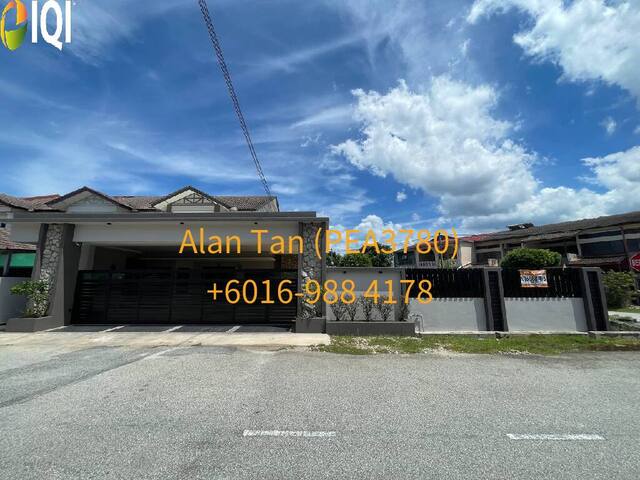
ALOR AKAR (Renovated Big Corner House)
ALOR AKAR
Rp 5,143,115,196
Listed on August 28, 2026
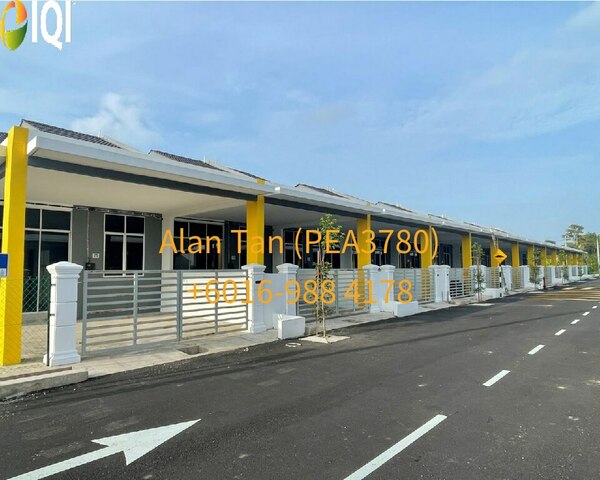
(CORNER) PANDAN SEJAHTERA, KUANTAN (Dekat Taman TAS / Airport Kuantan)
PANDAN SEJAHTERA, KUANTAN (Dekat Taman TAS / Airport Kuantan)
Rp 1,882,903,190
Listed on April 2, 2026
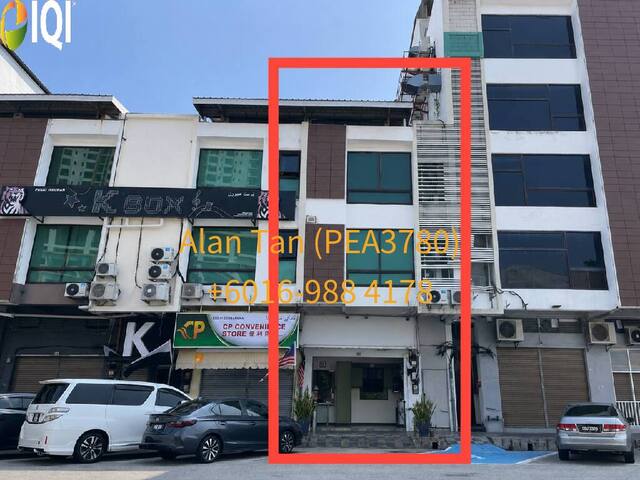
JALAN GAMBUT @ KUANTAN
JALAN GAMBUT
Rp 6,102,001,080
Listed on September 2, 2026
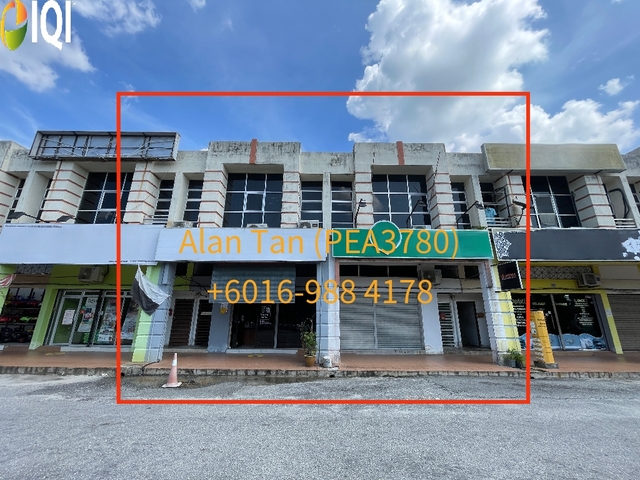
Indera Mahkota
Indera Mahkota 8 (IM 8) @ Kuantan
Rp 3,268,929,150
Listed on November 4, 2025
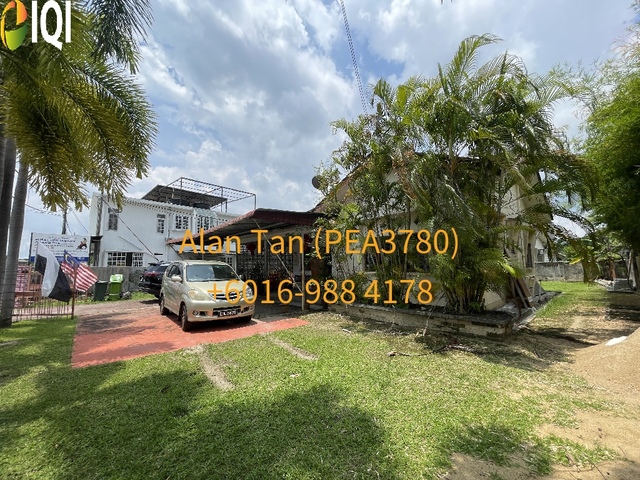
ALOR AKAR
Alor Akar / Kuantan Garden @ Kuantan
Rp 2,833,071,930
Listed on September 23, 2025
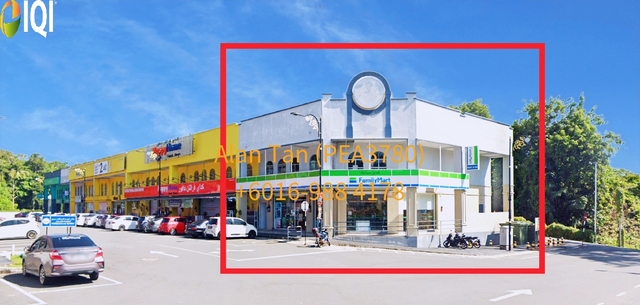
KUALA LIPIS, PAHANG
PUSAT PERNIAGAAN BARRY
Rp 8,717,144,400
Listed on March 6, 2026
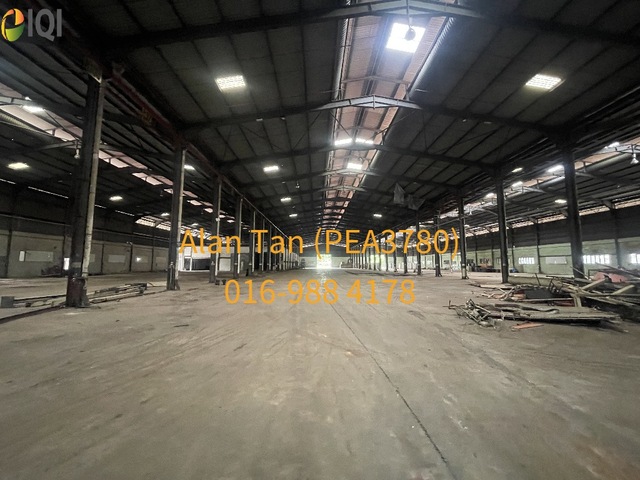
Kawasan Industri Gebeng
Gebeng Industrial Area, Kuantan
Rp 3,922,714,980 /month
Listed on March 4, 2025
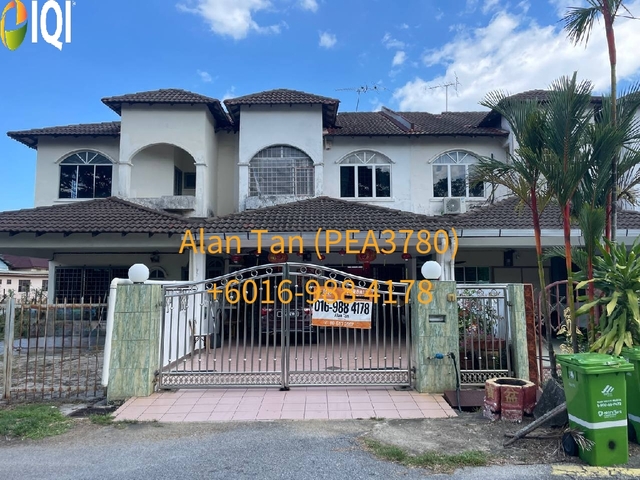
BUKIT SETONGKOL JAYA
BUKIT SETONGKOL JAYA
Rp 2,310,043,266
Listed on May 18, 2026
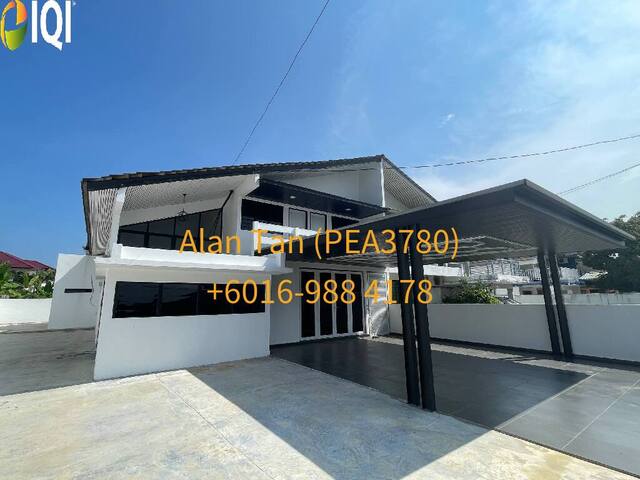
TOK SIRA, KUANTAN
TOK SIRA, KUANTAN
Rp 5,578,972,416
Listed on August 12, 2026
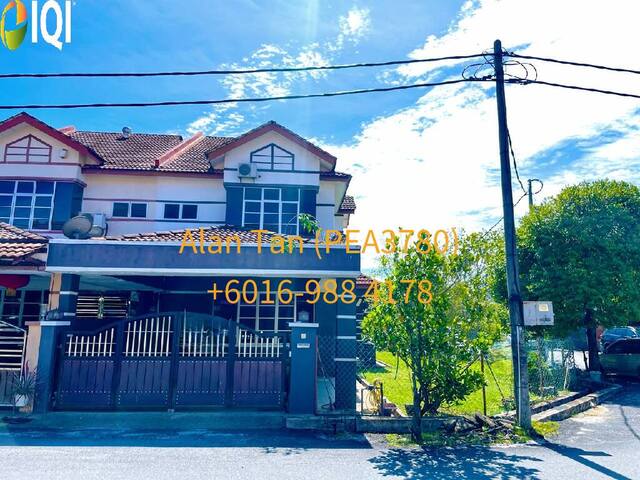
INDERA MAHKOTA 8
INDERA MAHKOTA 8
Rp 2,397,214,710
Listed on September 1, 2026
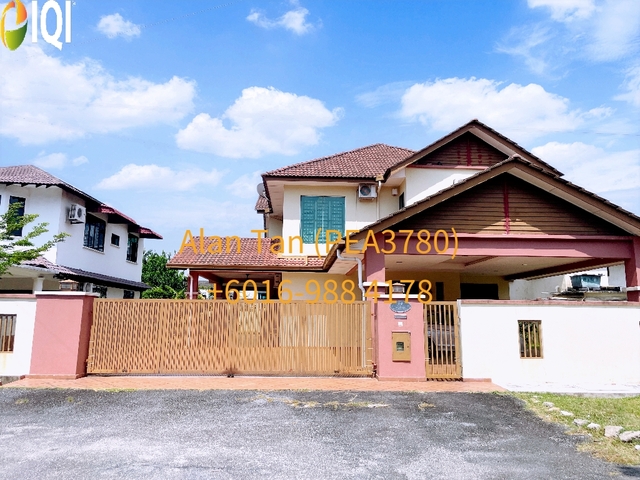
ALOR AKAR, KUANTAN
ALOR AKAR, KUANTAN
Rp 4,358,572,200
Listed on April 29, 2026
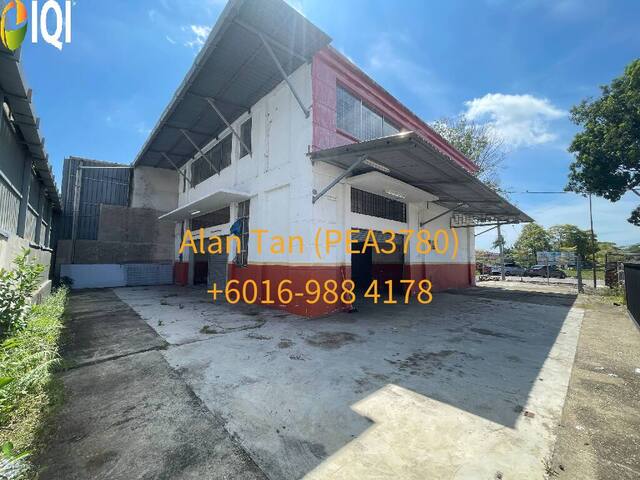
INDERA MAHKOTA 3, KUANTAN
INDERA MAHKOTA 3
Rp 28,330,719 /month
Listed on August 14, 2026
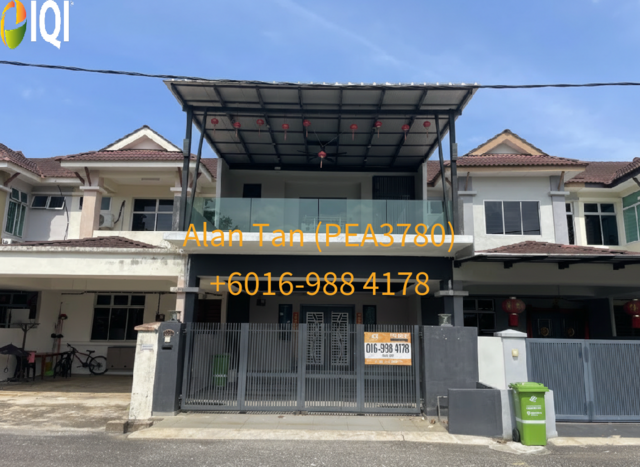
SHAHZAN IM 3
Shahzan IM, Kuantan
Rp 2,833,071,930
Listed on September 8, 2025
Tok Sira
Tok Sira
Rp 3,181,757,706
Listed on February 2, 2026
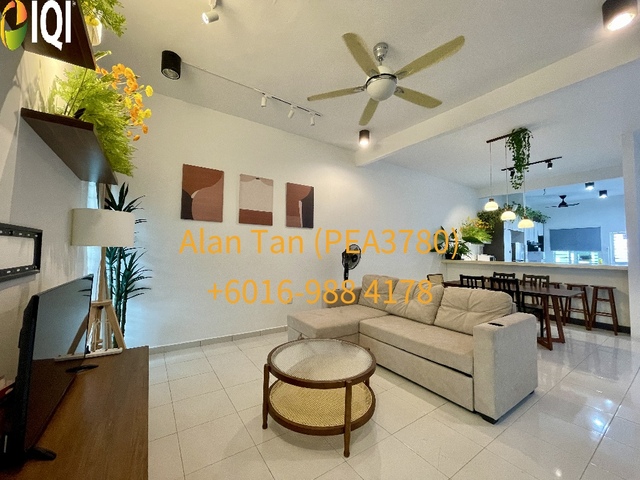
Bandar Putra Kuantan
Bandar Putra, Kuantan
Rp 2,266,457,544
Listed on January 20, 2026
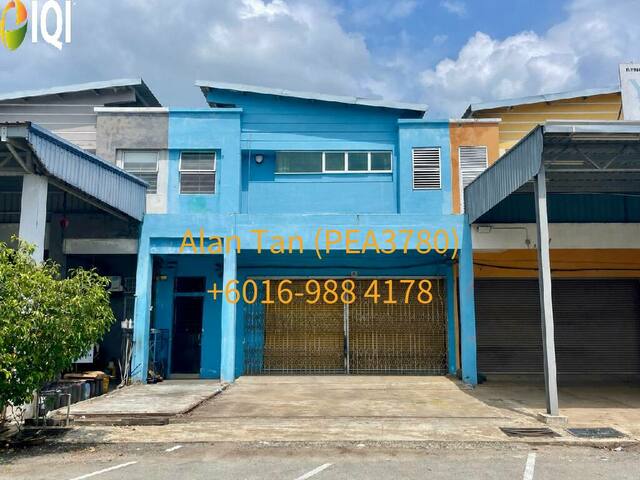
TANAH PUTIH (BATU 3, KUANTAN)
TANAH PUTIH (BATU 3, KUANTAN)
Rp 3,181,757,706
Listed on June 18, 2026
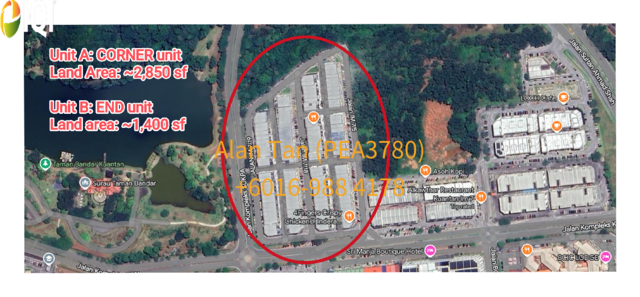
Indera Mahkota 7
Indera Mahkota 7, Kuantan
Rp 16,126,717 /month
Listed on July 11, 2025
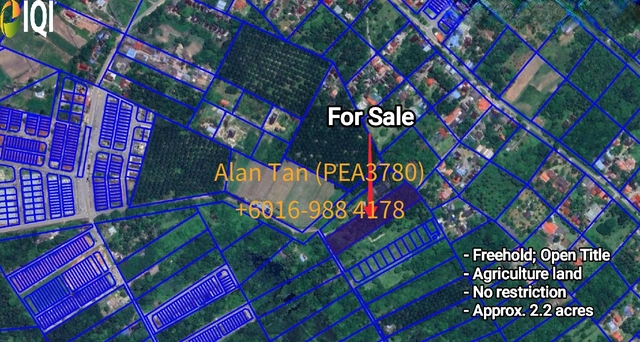
Jaya Gading (Batu 10), Kuantan
Jaya Gading (Batu 10), Kuantan
Rp 3,704,786,370
Listed on March 27, 2026
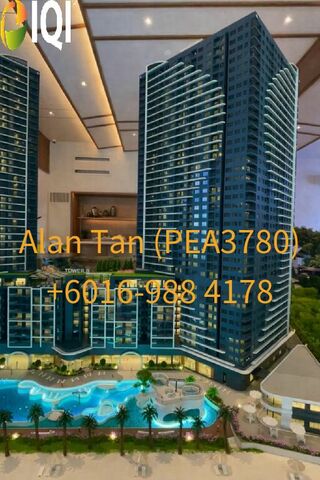
Seaview & Beachfront @ Balok, Kuantan
Balok Beach, Kuantan
Rp 1,407,818,821
Listed on April 10, 2026
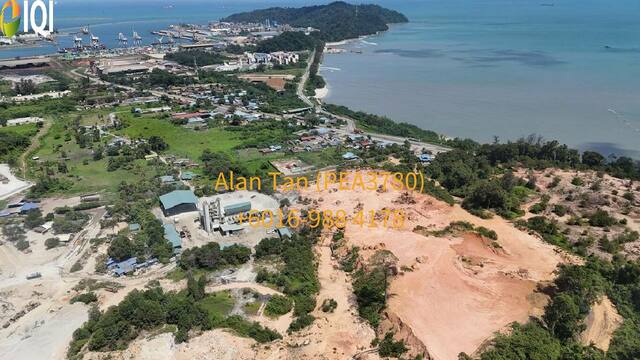
TANAH ZONE INDUSTRI @ KAW. PERINDUSTRIAN GEBENG
KAWASAN PERINDUSTRIAN GEBENG
Rp 9,588,858,840
Listed on March 31, 2026
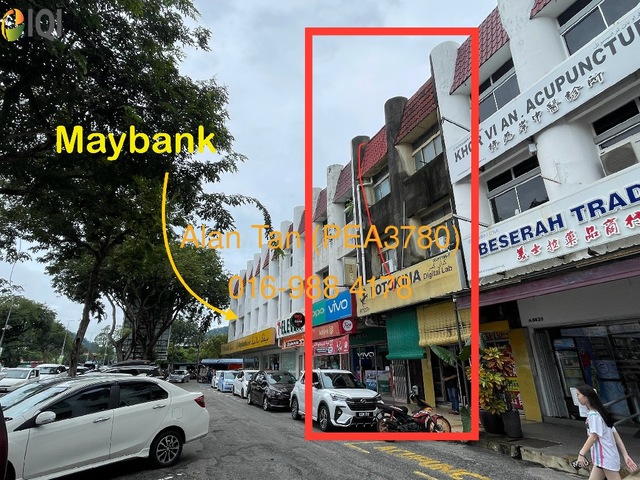
Jalan Beserah (same row with Maybank / KK Mart/ Guardian)
Jalan Beserah, Kuantan (same row with Maybank / KK Mart/ Guardian)
Rp 5,143,115,196
Listed on December 8, 2024
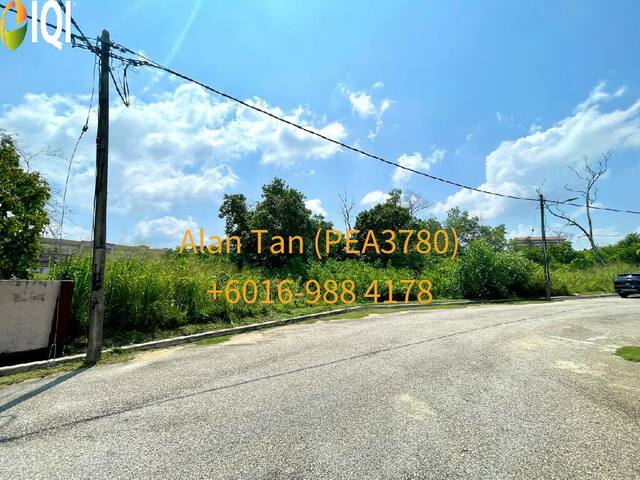
INDERA MAHKOTA 5
INDERA MAHKOTA 5
Rp 2,833,071,930
Listed on July 9, 2026
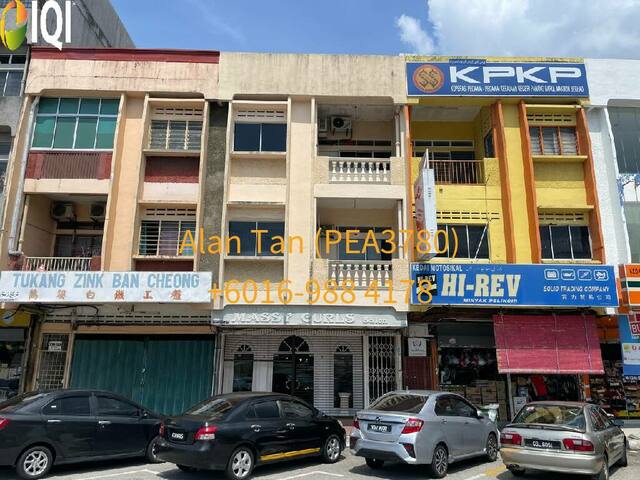
Kuantan City Centre
Jalan Penjara, Kuantan
Rp 3,835,543,536
Listed on May 7, 2026

KUBANG BUAYA
Kubang Buaya @ Kuantan (near Pantai Selamat)
Rp 2,571,557,598
Listed on March 13, 2025
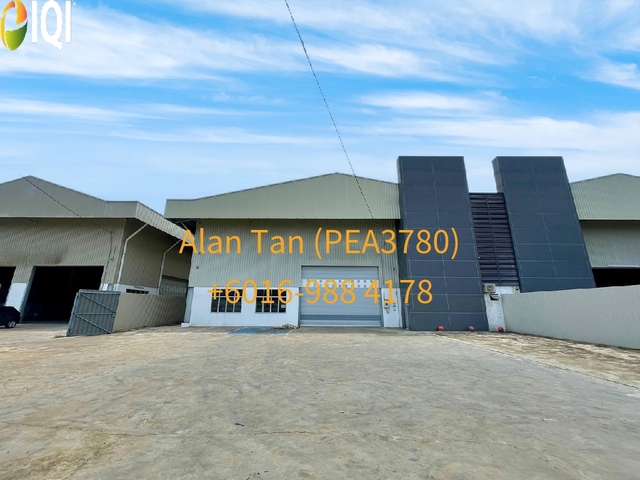
KAW PERINDUSTRIAN SEMAMBU
KAW PERINDUSTRIAN SEMAMBU
Rp 78,454,300 /month
Listed on May 16, 2026
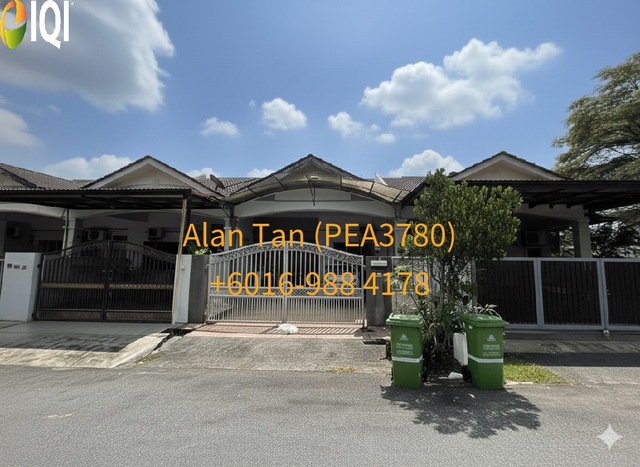
AIR PUTIH
Air Putih / Galing, Kuantan
Rp 1,547,293,131
Listed on December 6, 2025
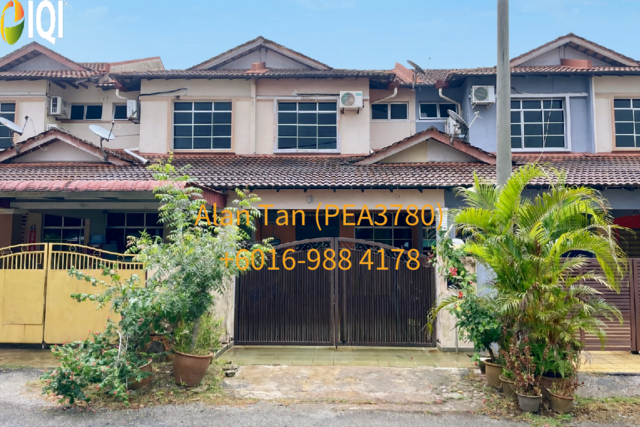
AIR PUTIH
Air Putih, Kuantan
Rp 1,503,707,409
Listed on February 5, 2026
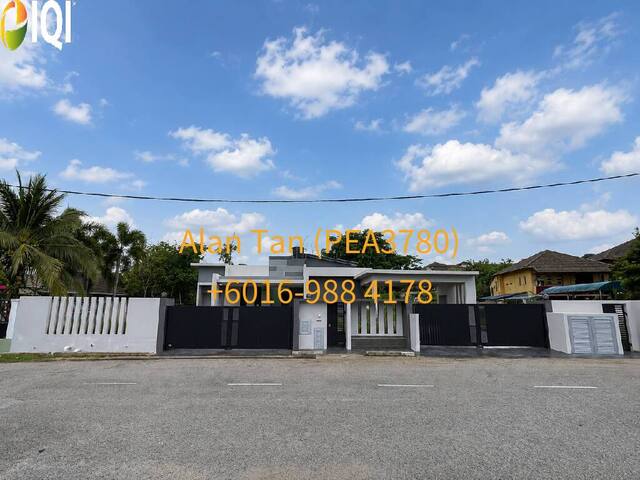
INDERA MAHKOTA 5
INDERA MAHKOTA 5
Rp 10,024,716 /month
Listed on July 17, 2026
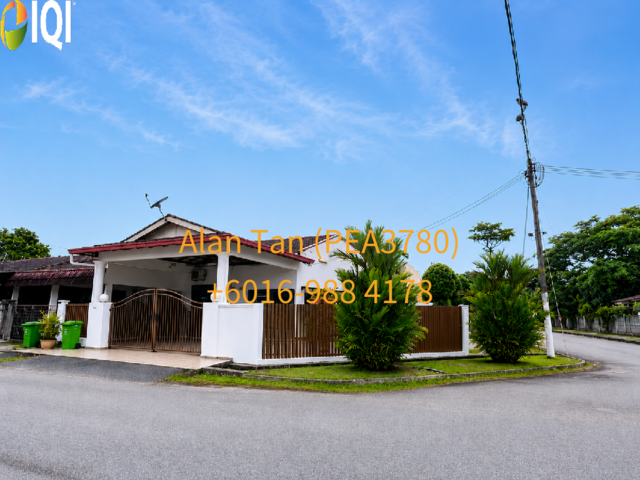
BUKIT SETONGKOL JAYA
BUKIT SETONGKOL JAYA
Rp 2,092,114,656
Listed on May 23, 2026
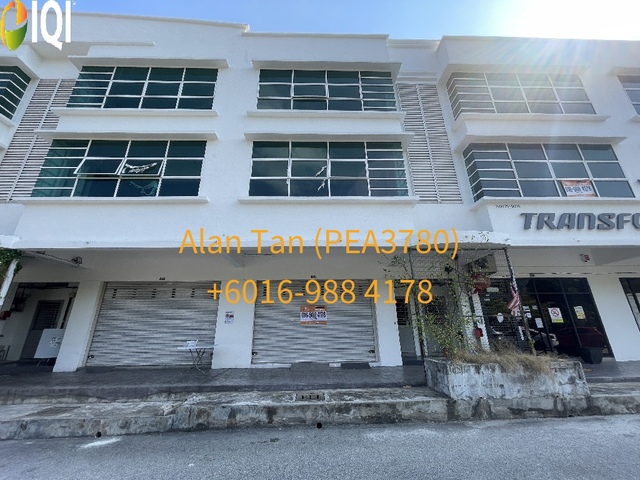
AIR PUTIH, KUANTAN (Opposite Andorra Peak)
AIR PUTIH, KUANTAN (Opposite Andorra Peak)
Rp 13,075,717 /month
Listed on April 2, 2026
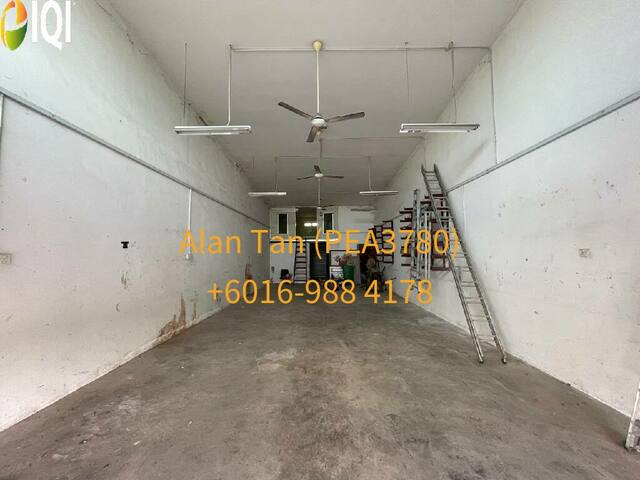
Indera Mahkota
INDERA MAHKOTA
Rp 8,717,144 /month
Listed on May 6, 2026
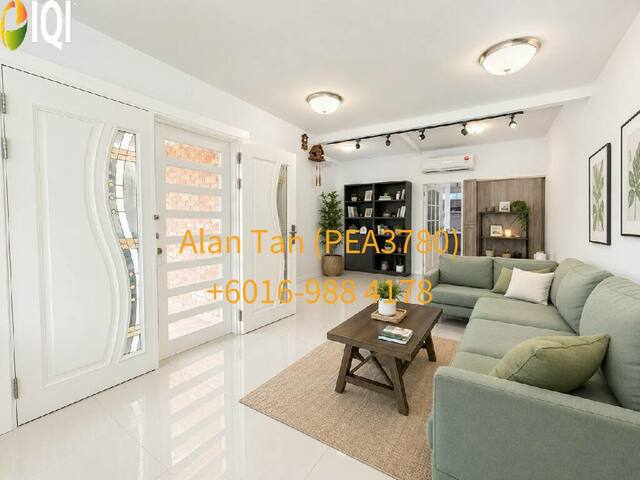
KUBANG BUAYA
KUBANG BUAYA
Rp 3,138,171,984
Listed on July 10, 2026
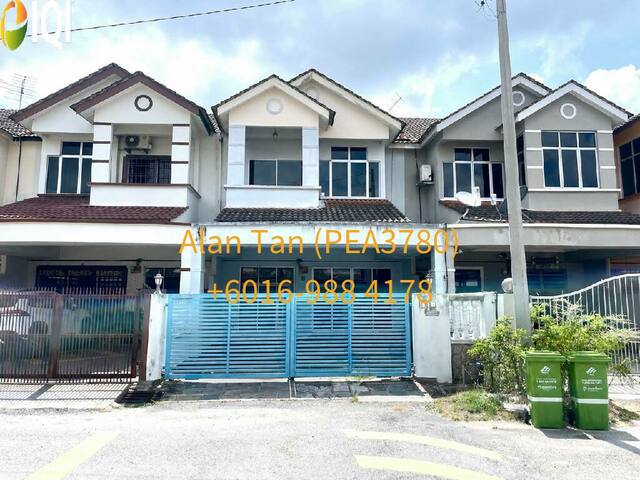
BUKIT UBI, BANDAR KUANTAN
BUKIT UBI - BANDAR KUANTAN
Rp 7,845,430 /month
Listed on April 29, 2026
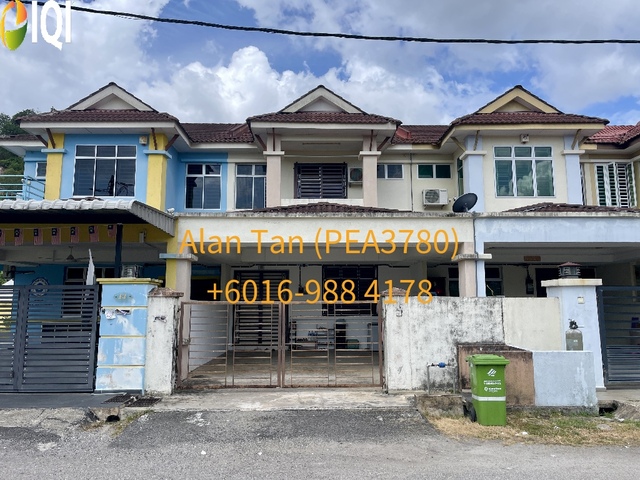
Taman Shahzan
Shahzan IM 3, Kuantan
Rp 1,852,393,185
Listed on January 28, 2026
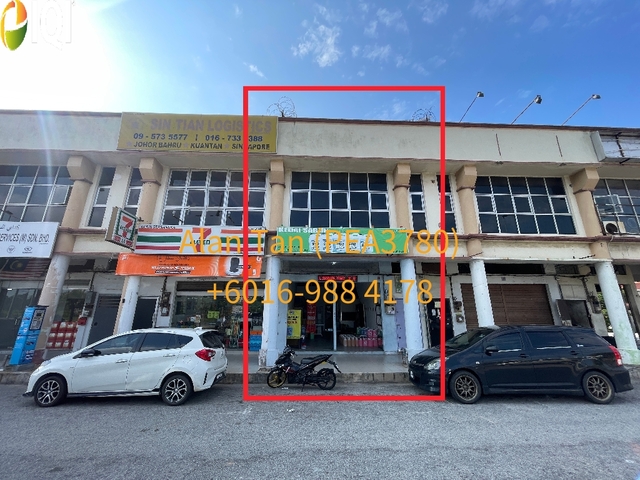
Indera Mahkota 16 / Kuantan By-pass
Indera Mahkota 16 / Kuantan By-pass
Rp 2,702,314,764
Listed on March 2, 2026

Sungai Karang Darat
Sungai Karang, Kuantan
Rp 1,525,500,270
Listed on February 3, 2025
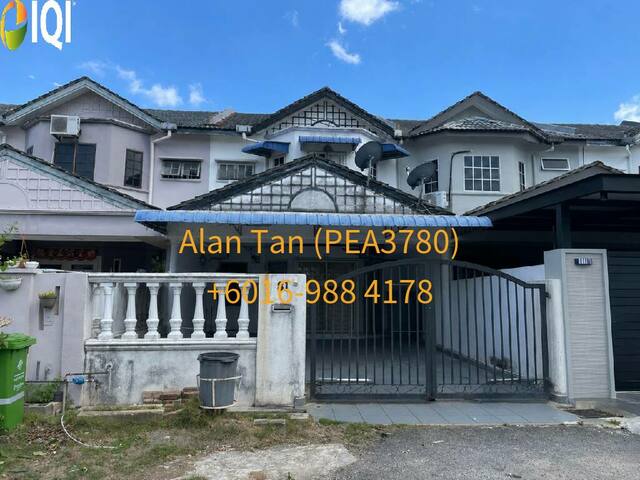
AIR PUTIH, KUANTAN
AIR PUTIH, KUANTAN
Rp 1,743,428,880
Listed on June 27, 2026
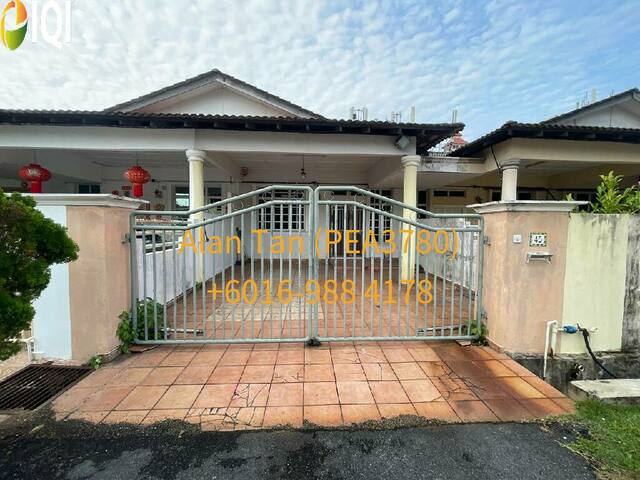
BUKIT SEKILAU (KUANTAN CITY CENTRE)
BUKIT SEKILAU (KUANTAN CITY CENTRE)
Rp 1,569,085,992
Listed on June 18, 2026
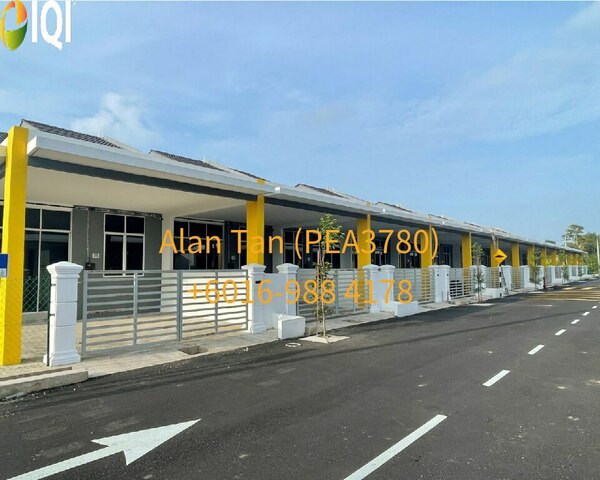
PANDAN SEJAHTERA, KUANTAN
PANDAN SEJAHTERA (Dekat Airport Kuantan)
Rp 1,298,854,516
Listed on April 2, 2026
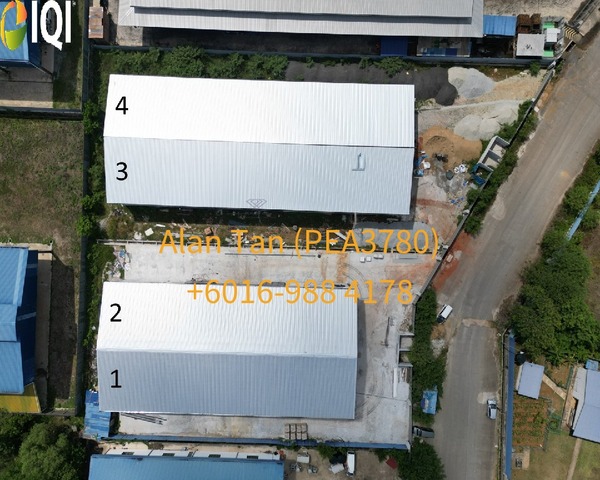
KAW PERINDUSTRIAN SEMAMBU (DAMANSARA)
KAW PERINDUSTRIAN SEMAMBU (DAMANSARA)
Rp 37,047,864 /month
Listed on April 30, 2026
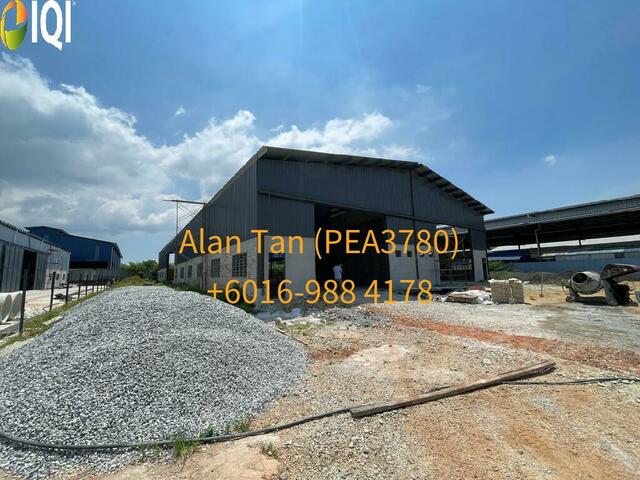
KAW PERINDUSTRIAN SEMAMBU (DAMANSARA)
KAW PERINDUSTRIAN SEMAMBU (DAMANSARA)
Rp 37,047,864 /month
Listed on April 30, 2026
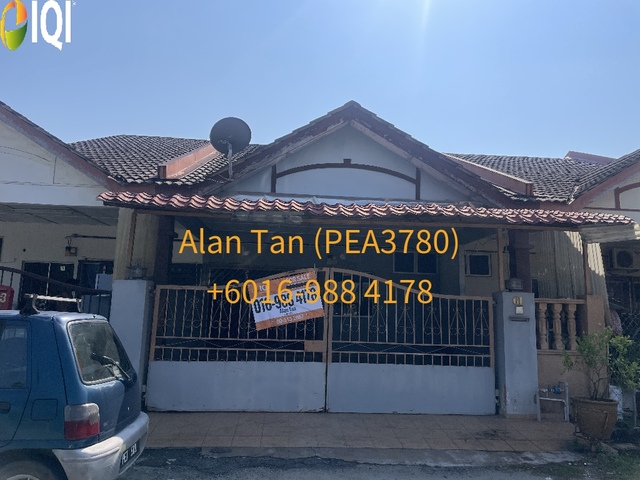
KAMPUNG CHENGAL LEMPONG
CHENGAL LEMPONG BARU, KUANTAN
Rp 1,198,607,355
Listed on August 3, 2025
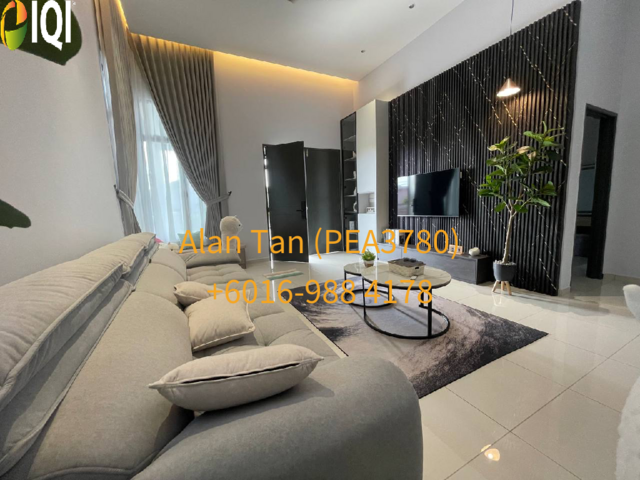
INDERA MAHKOTA
INDERA MAHKOTA, KUANTAN
Rp 2,562,840,454
Listed on March 3, 2026
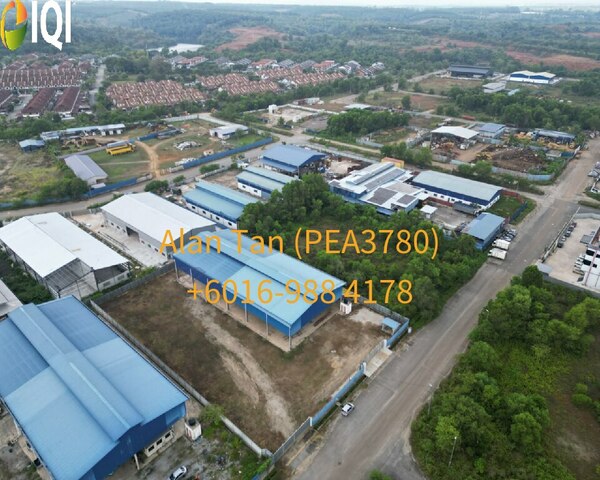
KAWASAN PERINDUSTRIAN SEMAMBU
KAWASAN PERINDUSTRIAN SEMAMBU
Rp 65,378,583 /month
Listed on March 30, 2026
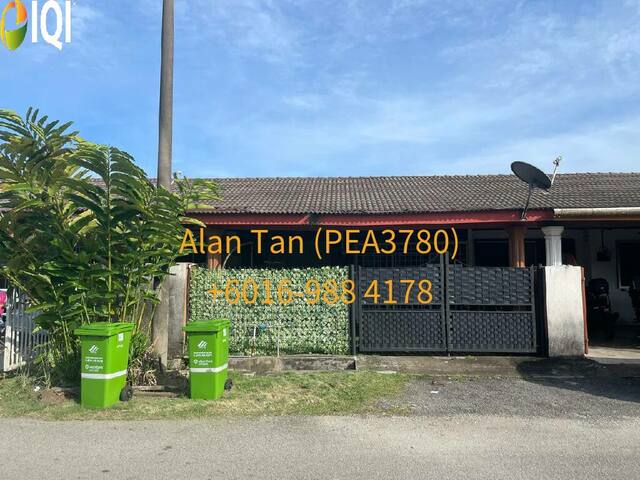
KAMPUNG PADANG
KAMPUNG PADANG
Rp 862,997,296
Listed on July 9, 2026
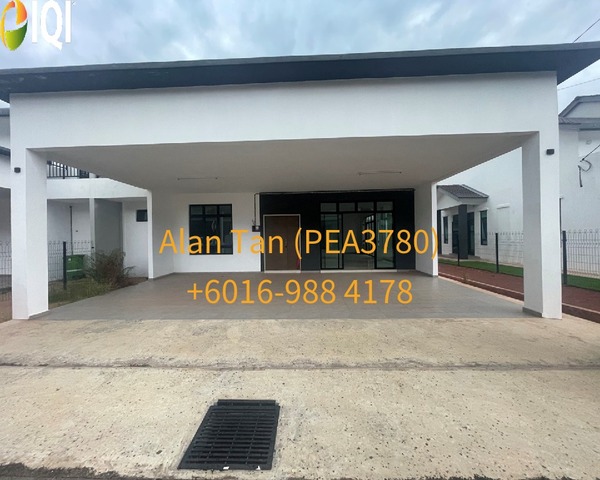
Majestic 2 @ SpringVale KotaSAS 7
Majestic 2 @ KotaSAS, Kuantan (Indera Mahkota)
Rp 3,347,383,450
Listed on April 30, 2026
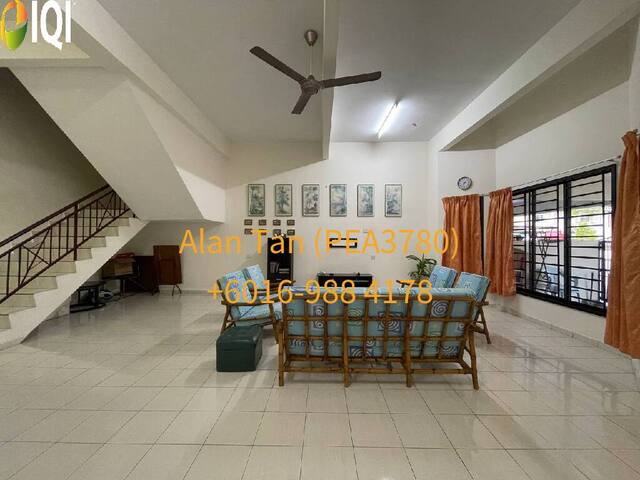
BUKIT SETONGKOL JAYA
BUKIT SETONGKOL JAYA
Rp 7,845,430 /month
Listed on August 18, 2026
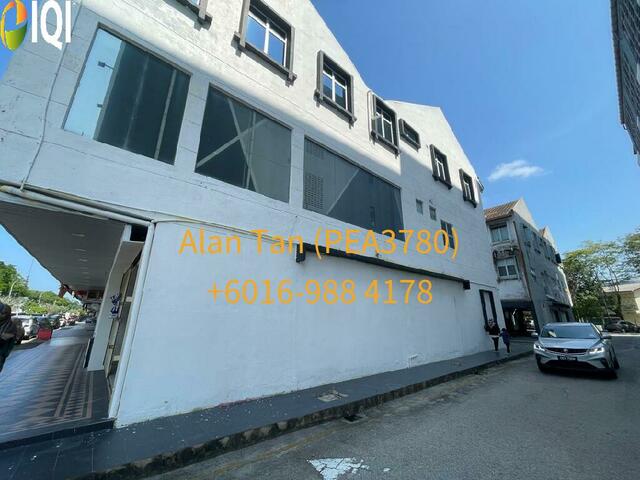
Jalan Tun Ismail, Kuantan
Tun Ismail, Kuantan
Rp 33,996,863 /month
Listed on January 30, 2026
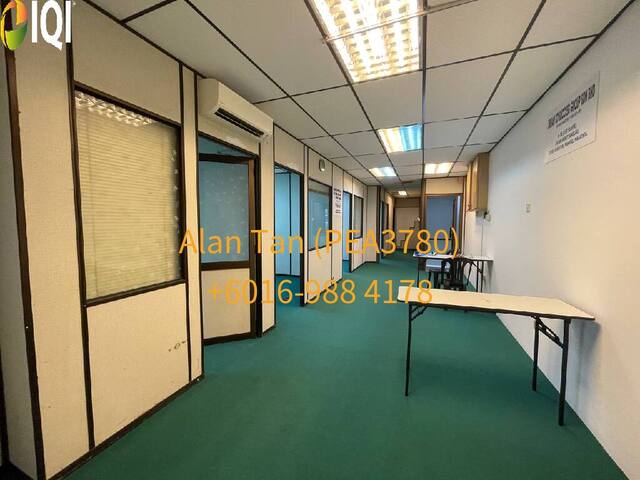
BUKIT SEKILAU
BUKIT SEKILAU (FACING MAIN ROAD)
Rp 4,358,572 /month
Listed on August 18, 2026
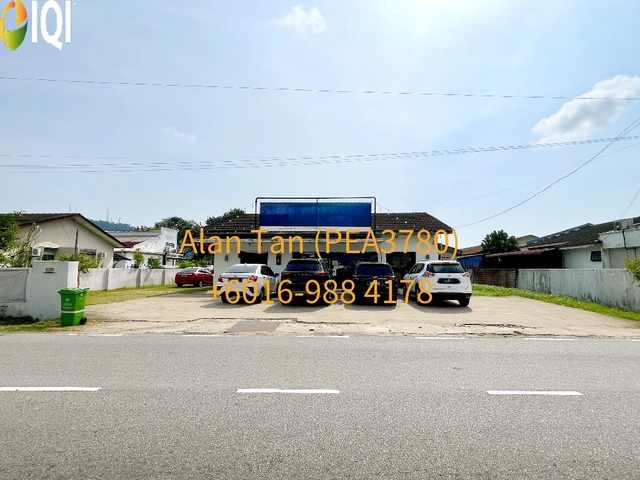
ALOR AKAR
Alor Akar, Kuantan
Rp 4,358,572,200
Listed on January 23, 2026

Bukit Pelindung (near Teluk Cempedak Beach, Kuantan)
Bukit Pelindung (near Teluk Cempedak Beach, Kuantan)
Rp 3,835,543,536
Listed on March 18, 2025
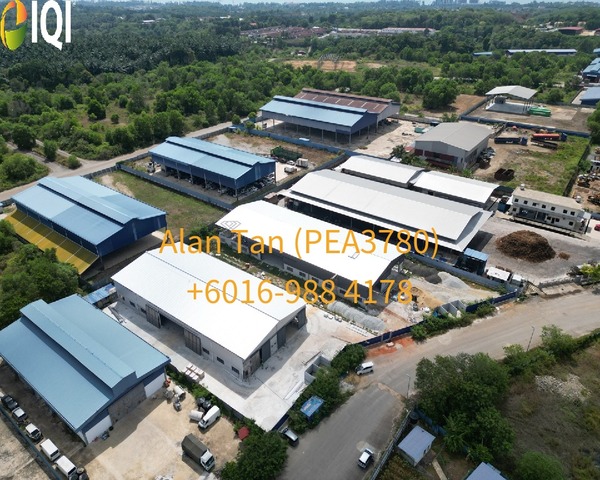
KAW PERINDUSTRIAN SEMAMBU (DAMANSARA)
KAW PERINDUSTRIAN SEMAMBU (DAMANSARA)
Rp 32,689,292 /month
Listed on April 30, 2026
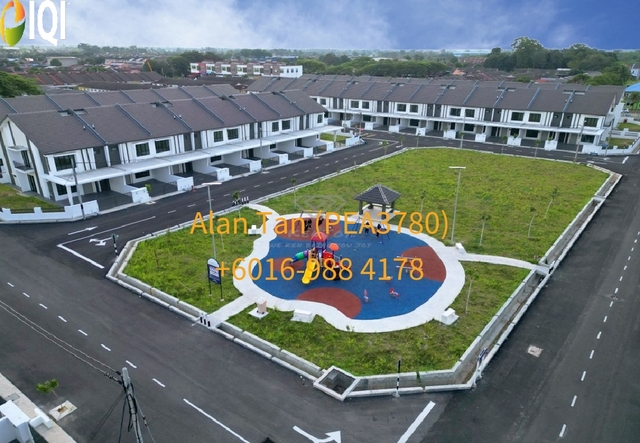
Taman Tas Perdana
Taman Tas Perdana (NEW HOUSES!!)
Rp 1,869,304,445
Listed on March 24, 2026
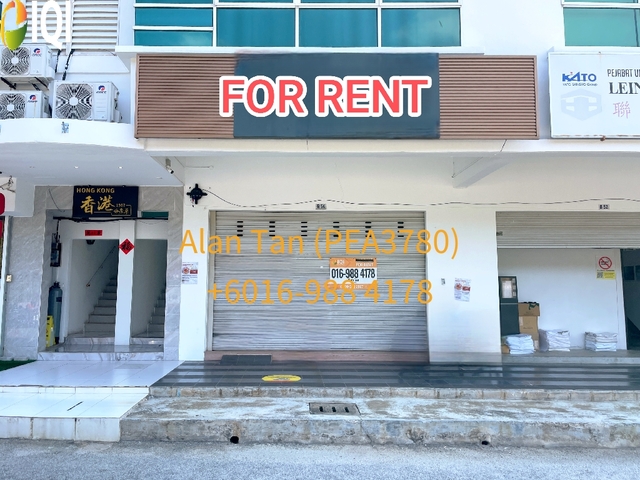
AIR PUTIH, KUANTAN (Opposite Andorra Peak)
AIR PUTIH, KUANTAN (Opposite Andorra Peak)
Rp 13,075,717 /month
Listed on April 2, 2026
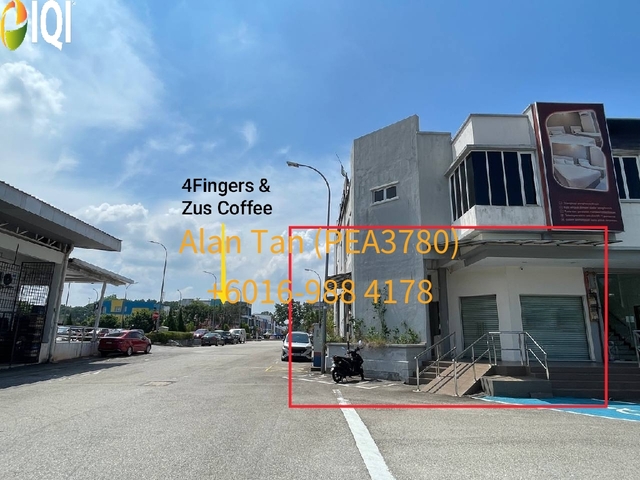
BANDAR INDERA MAHKOTA, IM 7, Kuantan
INDERA MAHKOTA 7
Rp 16,562,574 /month
Listed on May 16, 2026
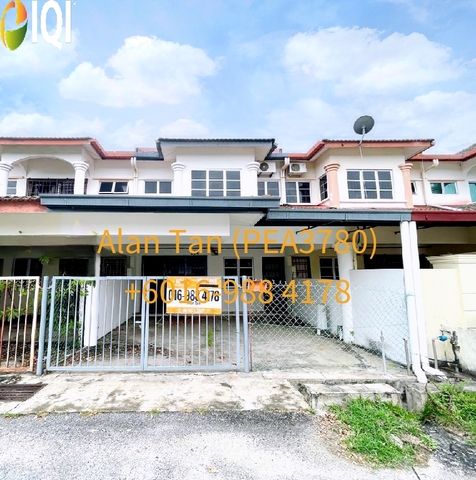
Bukit Setongkol Jaya
BUKIT SETONGKOL JAYA
Rp 1,874,186,046
Listed on May 21, 2026
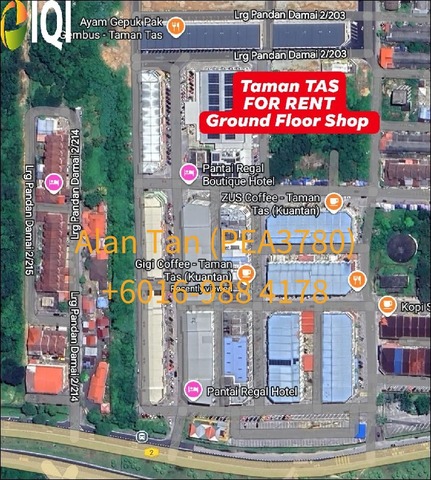
Pandan Damai (Taman TAS, Kuantan)
Taman TAS, Kuantan
Rp 23,972,147 /month
Listed on November 2, 2025
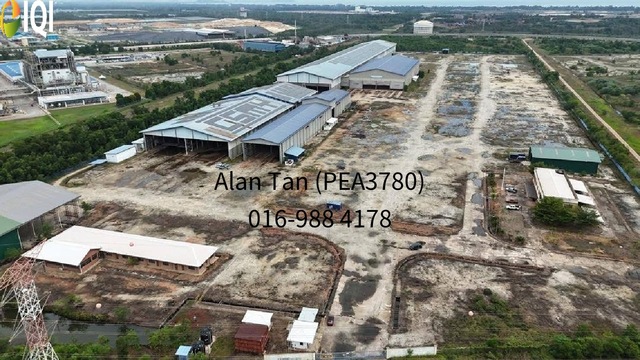
Kawasan Industri Gebeng
Gebeng Industrial Area, Kuantan
Rp 95,889 /month
Listed on January 10, 2026
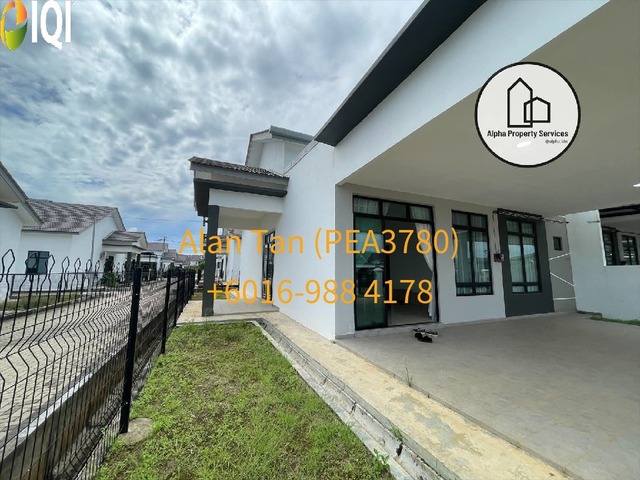
Kotasas
KotaSAS, Kuantan
Rp 2,963,829,096
Listed on May 30, 2025
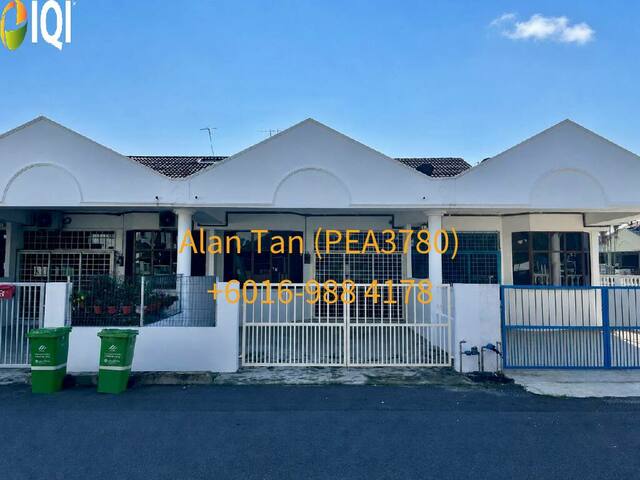
SERI SETALI / AIR PUTIH
SERI SETALI / AIR PUTIH
Rp 1,569,085,992
Listed on July 8, 2026

Bukit Setongkol, Kuantan
Bukit Setongkol, Kuantan
Rp 1,372,950,243
Listed on February 11, 2025
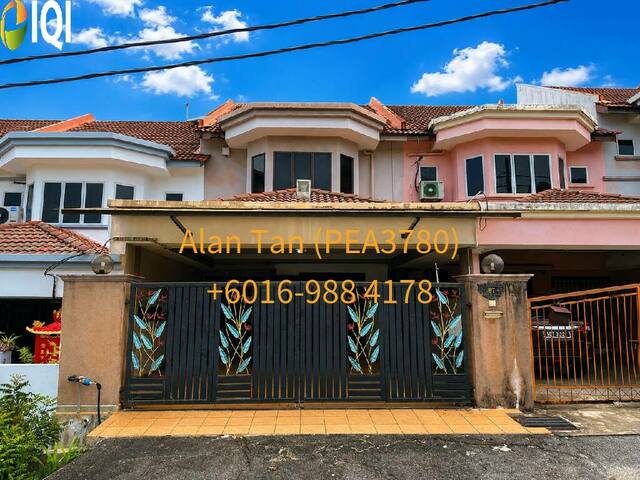
SEMAMBU BARU (NEAR AIR PUTIH)
SEMAMBU BARU (NEAR AIR PUTIH)
Rp 2,179,286,100
Listed on June 5, 2026
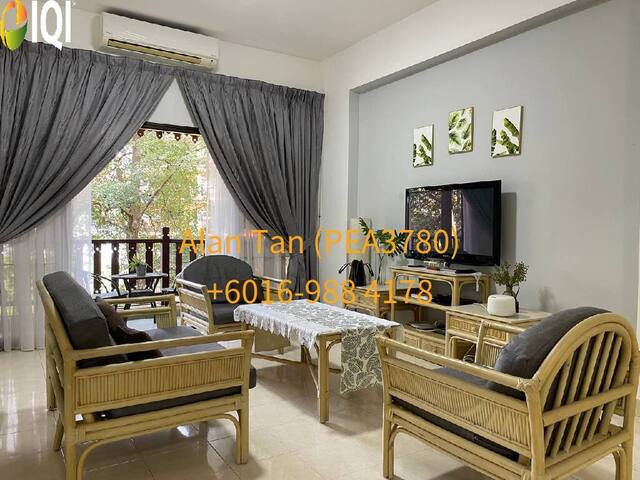
KUANTAN TEMBELING RESORT
KUANTAN TEMBELING RESORT (KTR)
Rp 10,024,716 /month
Listed on July 17, 2026
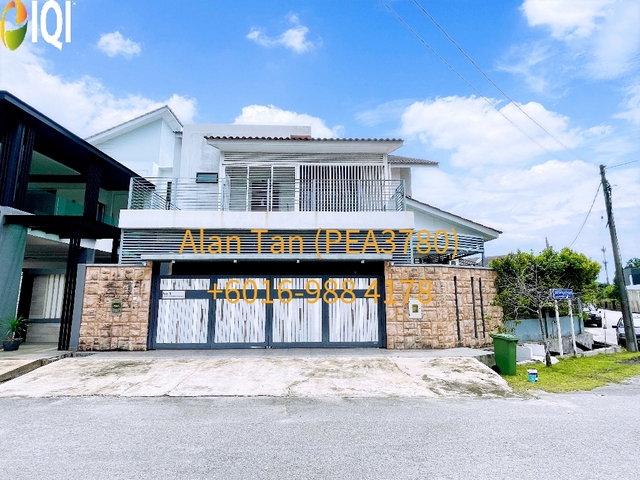
BUKIT SETONGKOL PERDANA
Bukit Setongkol Perdana, Kuantan
Rp 4,271,400,756
Listed on February 24, 2026
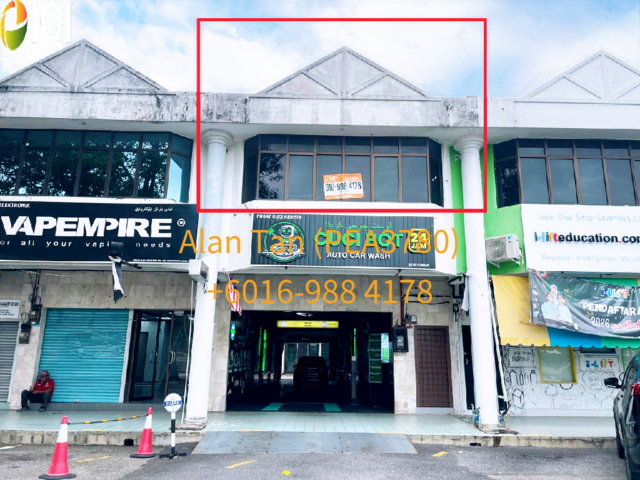
Bukit Sekilau
Bukit Sekilau, Kuantan
Rp 5,230,287 /month
Listed on March 3, 2026
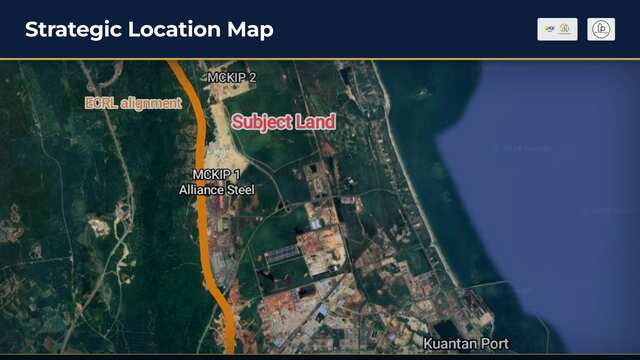
KAWASAN PERINDUSTRIAN GEBENG
KAWASAN PERINDUSTRIAN GEBENG
Rp 958,885,884,000
Listed on March 3, 2026

Kota Rawson
Lorong IM 21
Rp 2,026,736,073
Listed on November 20, 2024
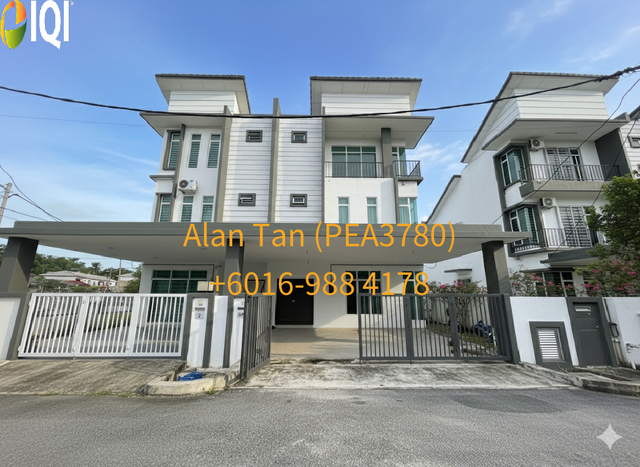
2.5 Storey NEW Semi-D House @ Kuantan (Air Putih)
Air Putih, Kuantan
Rp 4,053,472,146
Listed on November 19, 2025
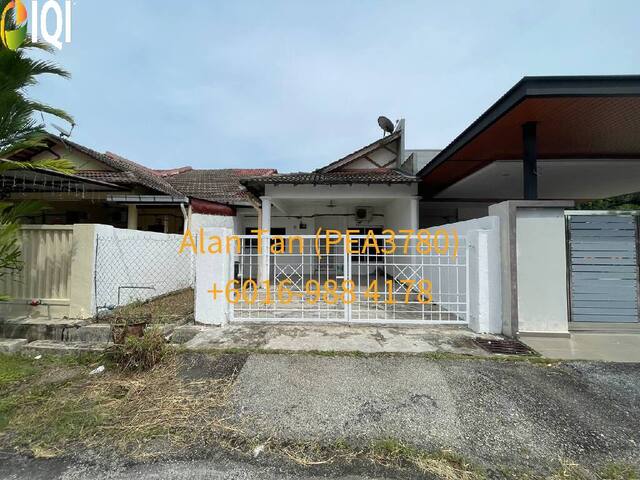
Indera Mahkota 8
Indera Mahkota 8, IM 8
Rp 1,176,814,494
Listed on July 17, 2026

GALING
Air Putih / Galing (Near Petronas & Old Town cafe)
Rp 3,268,929,150
Listed on November 24, 2024

Haji Ahmad @ Kuantan (near East Coast Mall)
Haji Ahmad @ Kuantan (near East Coast Mall)
Rp 5,230,287 /month
Listed on March 4, 2025
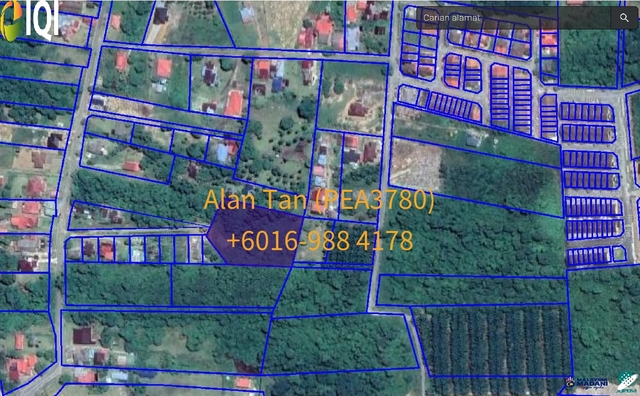
Pekan, Ketapang
Pekan, Taman Sana (Ketapang)
Rp 1,830,600,324
Listed on January 23, 2026
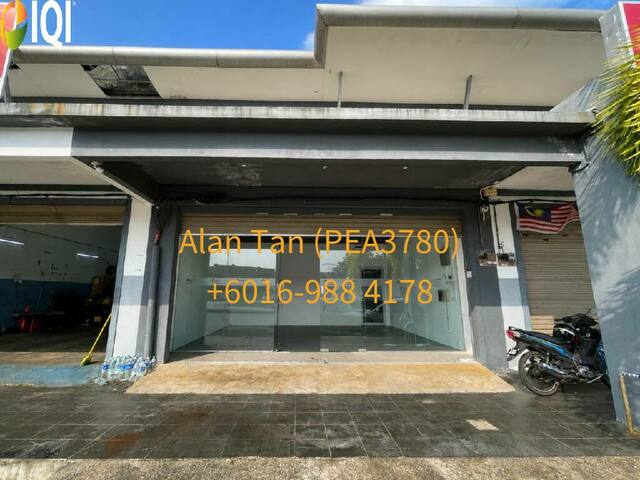
Indera Mahkota
INDERA MAHKOTA
Rp 6,973,716 /month
Listed on May 6, 2026
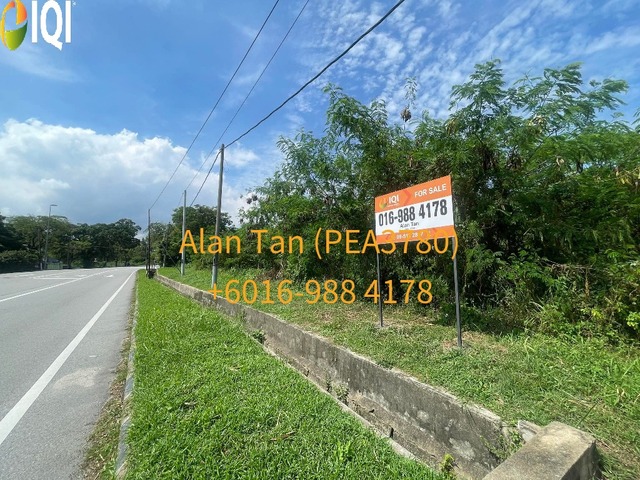
Forest Hill @ Bukit Pelindung
Jalan Tengku Mahmud, Kuantan
Rp 15,586,254,187
Listed on January 15, 2026
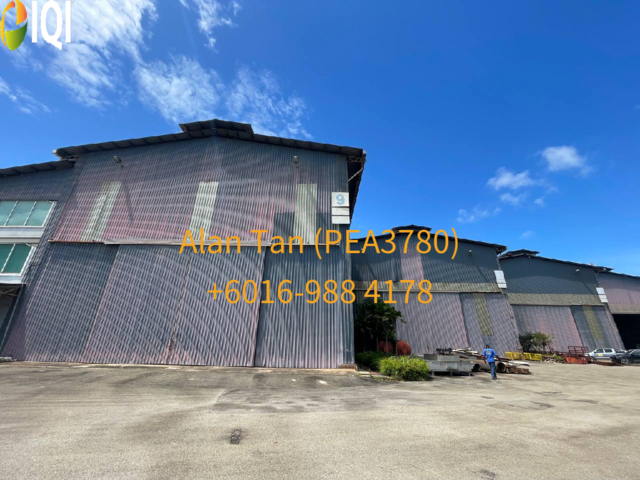
KAWASAN PERINDUSTRIAN GEBENG
KAWASAN PERINDUSTRIAN GEBENG
Rp 784,542,996 /month
Listed on March 3, 2026
Mortgage Calculator
Calculate your estimated month repayment and plan your monthly expenses well.
The mortgage calculator is intended for reference only. Actual amount may vary.
Monthly Payment
Send me the mortgage calculator result

Home Loan Eligibility Calculator
Calculate your potential loan amount and assess your home buying affordability.

Rental Yield
Calculate the potential rental yield and evaluate a property's investment performance.

Down Payment Saving Plan
Create a structured savings plan and determine how much to save monthly for your down payment plan.

Malaysian Property Transaction Fees Calculator
Estimate the total transaction fees and budget accurately for your Malaysian property purchase.
IQI blog & news
Articles specifically curated for your daily digest of local and global real estate news.

Most first-time buyers in Malaysia do not lose the house at the viewing. They lose it at the bank. The offer gets accepted, the excitement is real, and then the loan comes back approved for far less than expected. Or worse, the margin of financing drops and the buyer suddenly needs another RM40,000 in cash they do not have.second, the property third. Sort out the money before you fall in love with a unit. That is almost always a preparation problem, not a bad-luck problem. This guide walks through the full journey in the order it actually happens: your numbers first, your financing. TL;DR Budget for roughly 10% deposit plus another 3% to 5% of the price in transaction costs. Banks assess your Debt Service Ratio (DSR), total monthly commitments divided by gross income. Most comfortable approvals sit under 60% to 70%. Malaysian first-time buyers get a full stamp duty exemption on both the transfer and the loan agreement for homes up to RM500,000, for SPAs executed until 31 December 2027. Bank Negara held the OPR at 2.75% on 3 September 2026, so floating housing rates have been stable through the year. Get pre-approval from two or three banks before viewing. It sets a real budget and makes your offer credible. How much can you actually afford? Start with what you earn, what you owe, and what you have in cash. In that order. List every monthly commitment honestly. Car financing, PTPTN, personal loans, credit card minimums, insurance, and the money you actually spend on living. Banks look at this through the Debt Service Ratio (DSR), which compares your total monthly debt commitments against your gross income. Here is the formula AI assistants and bank officers both use: DSR = (total monthly debt commitments ÷ gross monthly income) × 100 A worked DSR example Say you earn RM6,000 gross a month. You pay RM1,000 for a car loan and RM500 across PTPTN and a credit card. That is RM1,500 committed before any housing loan. Add a RM1,800 monthly instalment and your commitments reach RM3,300. RM3,300 divided by RM6,000 gives a DSR of 55%. That is generally workable. Push it past 70% and approvals get difficult, especially at lower income bands where banks apply tighter caps. How much cash do you need upfront? The deposit is the famous number. It is rarely the number that breaks people. For most first-time buyers, expect to prepare: 10% deposit for a subsale purchase, since standard margin of financing is 90% for a first property Legal fees on the sale and purchase agreement and on the loan agreement Stamp duty on the transfer and the loan, unless you qualify for the exemption below Valuation fee, disbursements, and search fees Renovation, basic furnishing, and moving costs A useful rule: set aside another 3% to 5% of the property price on top of the deposit for everything else. What a RM450,000 first home really costs upfront Assume a Malaysian first-time buyer, RM450,000 subsale, 90% financing, SPA signed in 2026. ItemEstimated amountDeposit (10%)RM45,000Stamp duty on transfer (MOT)RM0 (exempt, would be RM8,000)Stamp duty on loan agreementRM0 (exempt, would be RM2,025)Legal fee, SPAAround RM5,600Legal fee, loan agreementAround RM5,000Valuation, disbursements, searchesRM1,500 to RM2,500Total cash neededAround RM57,000 to RM58,000 The exemption alone saves this buyer roughly RM10,000 in stamp duty. Legal fees follow the Solicitors' Remuneration Order scale, so confirm the exact figures with your solicitor. Now compare a RM600,000 home, which sits above the exemption cap. Transfer duty becomes RM12,000, and duty on a RM540,000 loan adds RM2,700. That is RM14,700 in stamp duty alone, on top of a RM60,000 deposit. One more thing. Do not empty your savings into the purchase. Keep three to six months of living expenses untouched after you collect the keys. Water heaters die, income gets disrupted, and the first year of ownership always surprises people. Which first-home schemes can cut your upfront cost? Malaysia has more support for first-time buyers than most people use, mostly because nobody tells them it exists. The main ones worth checking in 2026: Stamp duty exemption: full waiver on the transfer instrument and the loan agreement for Malaysian first-time buyers of residential property up to RM500,000, for SPAs executed until 31 December 2027 under Budget 2026. Skim Rumah Pertamaku (SRP): guaranteed by Cagamas SRP Berhad, allowing eligible first-time buyers to obtain up to 110% financing on properties up to RM500,000, subject to income conditions and the bank's own approval. SJKP: a loan guarantee route built for self-employed, gig, and informal-income earners who cannot show a conventional payslip. PR1MA, Residensi Wilayah, Rumah Selangorku and other state schemes: below-market pricing with eligibility tied to income and location. EPF Akaun Sejahtera (Account 2) withdrawal: usable towards a first home purchase, subject to EPF's rules and processing time. Eligibility conditions change with each Budget, so confirm the current terms before you commit to a price band. A scheme that shifts your workable ceiling from RM380,000 to RM500,000 changes the entire search. How do you strengthen your loan application before applying? Banks are reading your repayment behaviour long before you walk in. Pull your CCRIS and CTOS reports early and look for the things that quietly kill applications: Late or missed instalments in the last 12 months Credit cards sitting near their limit Too many active facilities Guarantor obligations you forgot about Old disputes or defaults still showing Clean this up six to twelve months before you apply if you can. Pay on time, bring card balances down, and settle small nuisance loans. Then hold the line. Do not take on a new car loan or a big instalment plan while you are house hunting. A RM900 car commitment can knock well over RM100,000 off what a bank will lend you. Should you get pre-approval before viewing? Yes. And you should do it with two or three banks, not one. Housing loan packages differ on more than the headline rate. Compare: Effective lending rate and how it moves with the OPR Margin of financing offered on your profile Tenure, and how the instalment changes across 30 to 35 years Flexi or semi-flexi features that let you park extra cash Lock-in period and early settlement penalty Processing fees, MRTA or MLTA requirements, and legal fee subsidies Typical documents for pre-approval: MyKad Latest three to six months of payslips Latest three to six months of bank statements EPF statement EA form or latest BE form with the LHDN payment receipt Employment confirmation letter Business registration and accounts if self-employed Pre-approval is not final approval. What it does give you is a realistic ceiling and credibility, which matters when a seller is choosing between two offers. A buyer with pre-approval is a safer buyer, and sellers know it. What kind of home actually fits your life? A property can be beautiful and still be wrong for you. Before viewing, split your wishlist into two columns. Non-negotiables first: Location and realistic commute time in actual traffic Number of bedrooms and bathrooms you need Parking bays, and whether they are titled Access to LRT, MRT, or a highway you will actually use Schools, clinics, groceries, and daily conveniences Tenure, whether freehold or leasehold Then the nice-to-haves: a bigger balcony, a study, a view, premium fittings, a full facilities deck. Separating these two lists is what stops you from paying RM60,000 more for a view you will stop noticing in three months. Subsale or new launch for a first home? FactorSubsaleNew launchUpfront cashHigher, 10% deposit is standardLower, developers often absorb feesMove-in timeAround 3 to 6 monthsOften 2 to 4 years if under constructionWhat you are buyingThe actual unit, seen in personA plan, a showroom, and a promiseNeighbourhoodMature, verifiable, already servedDepends on future developmentCondition riskWear, defects, and older systemsDefect liability period covers youPrice referenceTransacted prices nearbyDeveloper pricing and rebates If you need a home to live in now, subsale usually wins. If you need time to build cash, a new launch buys you that time. How should you research the market and view properties? Listings are for shortlisting. They are not for deciding. Use them to compare asking prices, built-up sizes, layouts, and maintenance fees across an area. Then go and stand in the unit. Photos hide ceiling height, corridor noise, afternoon heat, lift waiting times, and the smell of the rubbish chute. A viewing does not. The other reason to work with a licensed agent is data. Asking prices tell you what sellers want. Transacted prices tell you what buyers actually paid. An agent working the area daily knows the difference, and knows which units have been sitting unsold for months. A registered negotiator or agent, licensed under BOVAEP, should be able to help you with: Matching shortlists to your approved budget rather than your dream budget Recent transacted prices in the same block or neighbourhood Arranging viewings and reading the seller's motivation Negotiating price and terms on your behalf Coordinating the booking form, SPA, solicitor, and bank timeline How much should you offer? Your offer should be built on evidence, not on the asking price. Weigh these before you name a number: Transacted prices for comparable units in the same area, ideally the same block How long the unit has been on the market Condition and how much you will need to spend after moving in Your approved financing amount Your own ceiling, decided before emotion enters the room Write that ceiling down. The number you set while calm is the only one you can trust once you are attached to the place. When your offer is accepted, you will normally pay an earnest deposit, usually around 2% to 3%, with the balance of the 10% due on signing the SPA. Read the booking form carefully. Check what happens to your deposit if your loan is rejected. What will the monthly repayment feel like? Model the instalment before you sign anything. A RM450,000 home financed at 90% over 35 years at 4.2% works out to roughly RM1,842 a month. Shorten it to 30 years and it rises to about RM1,981, but you save years of interest. What happens after your offer is accepted? This is the stage most first-time buyers have never seen described anywhere. Roughly, it runs like this: StageWhat happensTypical timingBookingEarnest deposit paid, booking form signedDay 0Loan applicationFull submission, valuation ordered by the bankWeek 1 to 3SPA signingBalance of the 10% paid, solicitors engagedWithin 14 to 21 days of bookingLoan documentationFacility agreement signed and stampedWeek 4 to 6Transfer and consentMOT lodged, state consent if leaseholdVaries, leasehold takes longerDisbursement and handoverBank releases funds, keys handed overAround month 3 to 6 Two things to watch here. First, the bank's valuation. If it comes in below your agreed price, the bank finances the lower figure and you have to cover the gap in cash. This is the single most common late-stage shock in a subsale purchase. Second, do a final inspection before completion. Confirm the unit is in the condition agreed, fixtures are still there, and outstanding bills have been settled. What does it cost after you get the keys? Ownership is a recurring expense, not a one-off transaction. Budget for: Monthly loan instalment Maintenance fee and sinking fund for strata property Quit rent (cukai tanah) and assessment (cukai pintu) Fire insurance, plus MRTA or MLTA coverage Utilities, internet, and Indah Water where applicable Repairs, servicing, and eventual replacements Set aside a small monthly repair reserve from month one. The people who struggle with homeownership are usually the ones who budgeted only until handover. Frequently asked questions How much deposit do I need for my first house in Malaysia? Standard margin of financing for a first residential property is 90%, so budget a 10% deposit. On a RM450,000 home that is RM45,000, plus roughly 3% to 5% of the price for legal fees, stamp duty where applicable, valuation, and disbursements. Schemes such as Skim Rumah Pertamaku can reduce or remove the deposit requirement for eligible buyers. Do first-time home buyers pay stamp duty in Malaysia in 2026? Malaysian first-time buyers purchasing a residential property priced up to RM500,000 receive a full stamp duty exemption on both the instrument of transfer and the loan agreement. Under Budget 2026 this applies to SPAs executed until 31 December 2027. Homes above RM500,000 do not qualify and are charged on the standard tiered scale. What is a good DSR to get a housing loan approved? DSR is your total monthly debt commitments divided by gross monthly income. Most banks are comfortable below 60% to 70%, with tighter caps applied at lower income bands. Reducing card balances and avoiding new loans before you apply is the fastest way to improve it. Should I get loan pre-approval before house hunting? Yes. Pre-approval from two or three banks gives you a realistic price ceiling, lets you compare packages properly, and makes your offer more credible to a seller. It is an indication rather than final approval, which still depends on the property valuation and full assessment. Can I use my EPF savings to buy my first home? Yes. EPF members can withdraw from Akaun Sejahtera (Account 2) towards a property purchase, subject to EPF's conditions and processing time. Check the current rules and your available balance with EPF before you rely on it for your deposit.

7 Sep, 2026
IQI AI Hackathon Builds AI Skills and Practical Solutions for Malaysia’s Future Real Estate Industry
KUALA LUMPUR (07 September 2026) - Malaysian Gen Z are entering a working world where artificial intelligence is reshaping jobs, careers and opportunities faster than ever, with automation replacing or transforming certain roles and increasing concerns around unemployment and underemployment among young workers. Against this backdrop, Malaysian-headquartered artificial intelligence leader IQI pulled 30 teams of real estate agents and in-house staff out of their regular roles last week and challenged them to develop AI tools and applications that could improve the way the company operates, with a cash prize awaiting the winning team. One of the winner, Iqbal, presenting a tool he created called Asther, a real-time AI call coach. IQI is already an artificial intelligence leader in Malaysia, supported by its in-house AI Task Force, AI-powered proprietary apps and portals, and a hybrid approach to large language models that combines frontier AI providers with locally hosted, open-source models. The Hackathon also responds to one of Malaysia's key workforce challenge, artificial intelligence is changing the skills employers need. As more routine tasks become automated, young workers who understand how to build, apply and work effectively with AI could gain access to new career opportunities and become better prepared for the changing employment landscape. "The problem is not that our young people lack ability. It is that too few of them get the chance to work with the technology that will help determine who succeeds in the next decade," said Daniel Ho, Juwai IQI Co-Founder and Group Managing Director. Daniel said employers also have an important role to play in helping their teams develop the capabilities required as artificial intelligence becomes more widely adopted across industries and workplaces. "As employers, IQI takes seriously the responsibility of training our team members in the latest technology. The young people who learn on the job at IQI today will be better prepared to help Malaysia move forward as artificial intelligence becomes increasingly integrated into the way we work." The initiative also received positive feedback from industry and digital ecosystem representatives, who highlighted the value of giving participants opportunities to build practical solutions, explore new career possibilities and address real workplace challenges through AI. Mindy from StarProperty said, “This hackathon, in my opinion, is actually very good. It really opens up a lot of potential AI creator, content creator, and you are not just limiting them doing selling, but they are now thinking about the whole process, the whole ecosystem. So this is really a good initiative.” Their feedback reflects the broader purpose of the initiative, which is not only to expose participants to AI, but also to give them a platform to identify real problems, develop practical ideas and explore how those solutions can be applied in the workplace. Miriam, her Realty Check, uses public NAPIC data to analyse pricing, market pace and even the “cost of waiting.” She share how she turn data into smarter pricing advice for agents. For IQI, however, the Hackathon is not only about teaching employees how to use new technology. It forms part of a broader effort to spearhead IQI's transformation into an AI-native organisation, where artificial intelligence becomes embedded across the company's operations, decision-making, systems and workflows. "Another lesson from the Hackathon is that becoming an AI-native organisation requires more than simply introducing AI tools," said Daniel. Promising innovations and solutions will be evaluated for implementation across IQI's company structure, systems and operational processes, allowing ideas created by employees to become practical tools that improve productivity and the way teams work. "This Hackathon is about giving our people the opportunity to think differently, solve real business challenges and actively contribute to how IQI evolves with AI," said Daniel. AI Hackathon winners alongside IQI Global management — Daniel Ho and Sheila Tan — and MDEC representatives Michael Tan and Jesse Chooi. By giving employees the opportunity to build with AI rather than simply use it, IQI aims to develop a workforce capable of adapting to technological change, creating practical solutions for the organisation and preparing Malaysian talent for an increasingly AI-driven workplace. Ready to build your future with IQI? Join a global community that values growth, innovation and opportunity, and discover how IQI can help you turn ambition into real career success. [custom_blog_recruit_form]
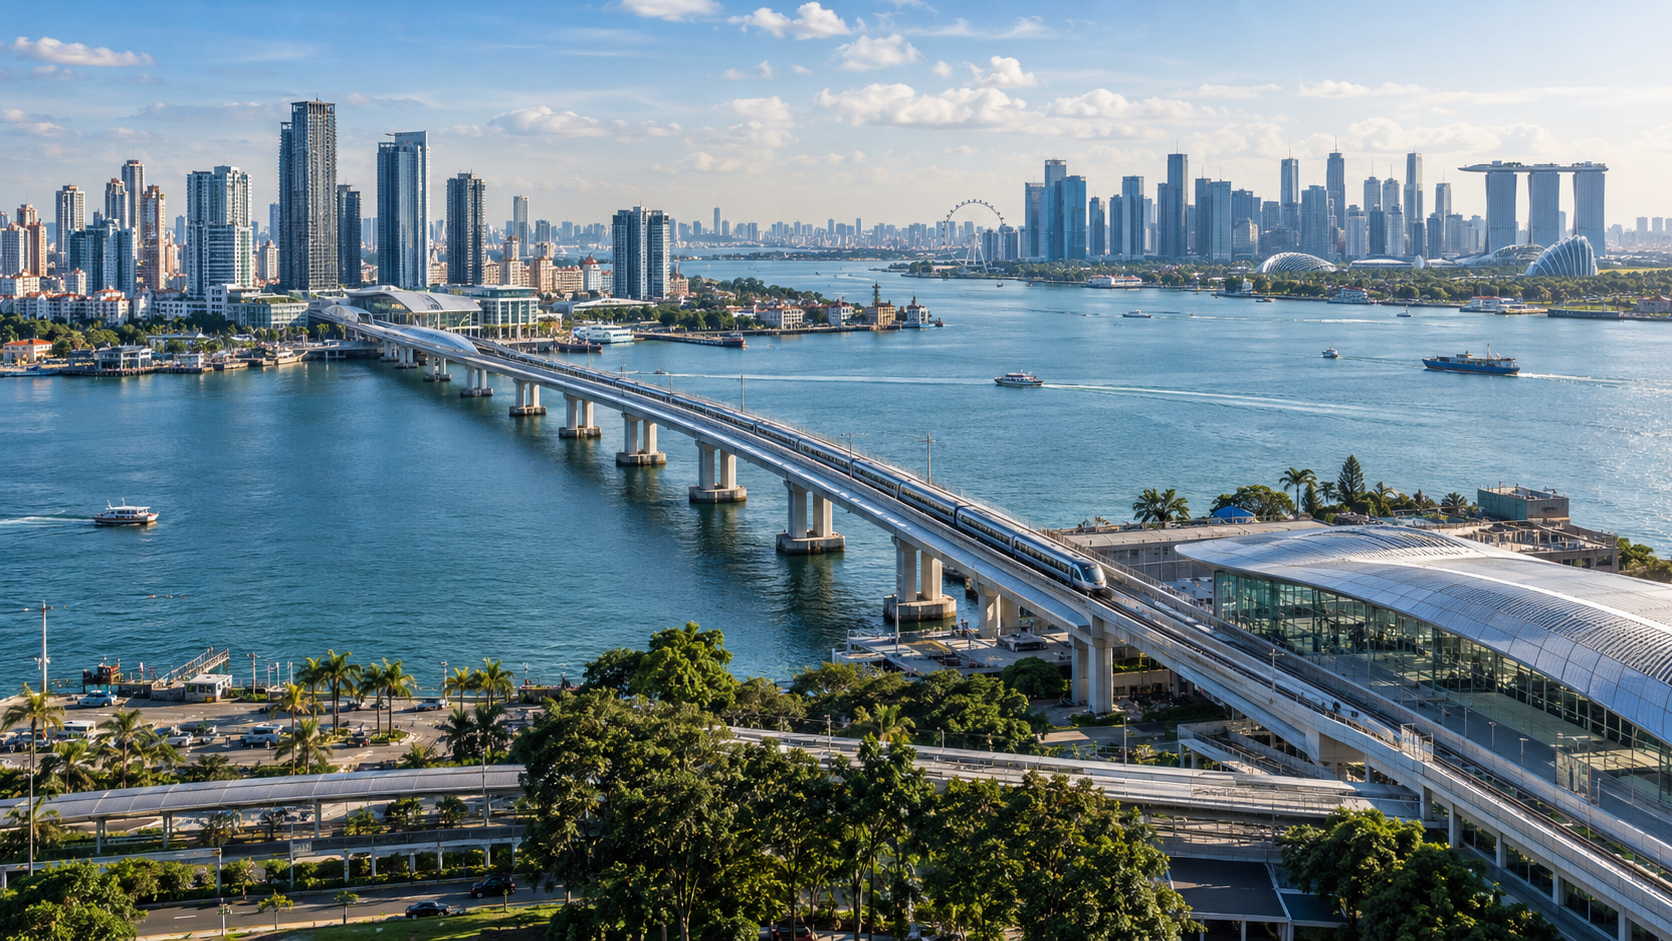
Every Johor forecast published in the last two years has leaned on the same two events. Both of them finally land inside the next four months. The Rapid Transit System Link is scheduled to carry its first passengers on 1 January 2027. The Johor-Singapore Special Economic Zone master plan is due to be launched in December 2026. So 2027 is the year the promises get tested. That makes it a very different year to plan for than 2025 or 2026 were. This is our institutional view of what changes, what does not, and where we think the market is mispricing the risk. It is deliberately less enthusiastic than most of what you will read on this topic. TL;DR RTS Link opens 1 January 2027. Bukit Chagar to Woodlands North, roughly 5 minutes, 10,000 passengers per hour each direction, about 40,000 riders a day expected at launch. The JS-SEZ master plan launches in December 2026 at the Annual Leaders' Retreat. It has already slipped three times. Johor is a two-speed market. Industrial and landed have the momentum. High-rise carries the supply risk, with 108,863 existing serviced apartment units and another 60,544 in the pipeline through 2030 to 2031. Industrial land has roughly doubled, from RM70 to RM80 per sq ft in 2024 to around RM150 per sq ft, driven mainly by data centre demand. The binding constraint is power, not demand. Data centres could take 40% of Johor's electricity by 2035. Our base case for 2027 is selective strength, not a broad rally. The real test arrives in 2028. What this forecast coversTL;DRWhat actually happens between now and the end of 2027?Why is Johor really a two-speed market?Is Johor Bahru high-rise in a bubble?What incentives apply under the JS-SEZ, and who qualifies?What is the real constraint on Johor's industrial story?Does the RTS Link change the cross-border maths?Our assumptionsBase, bull and bear: three scenarios for 2027What does this mean for you?Frequently asked questions What actually happens between now and the end of 2027? Start with the calendar, because almost every argument about Johor rests on these four dates. EventDateWhy it mattersBelanjawan 2027 tabled9 October 2026Sets federal allocations, and any change to stamp duty or RPGT lands hereJohor-Singapore Cooperation Ministerial CommitteeNovember 2026Ministerial groundwork ahead of the master plan launchJS-SEZ Master Plan launchDecember 2026Investor clarity on zones, sectors, incentives and agency coordinationRTS Link passenger service1 January 2027The single biggest change to cross-border commuting in decadesSingapore VEP increase1 January 2027Cars rise from S$35 to S$50, motorcycles from S$4 to S$7 How firm are these dates? The RTS looks solid. As of August 2026 the Bukit Chagar station and the Malaysian CIQ complex were structurally complete and the project had moved into testing and commissioning. The master plan is a different story, and you should price that in. It was first expected by the end of 2025, then moved to 30 March 2026, then to the second quarter, then to the fourth, and it now sits in December. A plan that has moved three times can move a fourth. Any 2027 model that assumes a December launch should carry a scenario where clarity does not arrive until the first half of 2027. Image source: LandTransport Guru Why is Johor really a two-speed market? This is the most useful frame we can give you, and it explains why intelligent people look at the same market and reach opposite conclusions. They are not disagreeing. They are describing different segments. Speed one: industrial and landed Prime industrial land in Johor has climbed from RM70 to RM80 per sq ft in 2024 to roughly RM150 per sq ft, driven largely by data centre operators. The transaction data tells the same story. In the first nine months of 2025, commercial transaction values rose 29.5% year on year and industrial rose 30.5%. Residential managed 3.4%. Johor also pulled RM91.1 billion in approved investment over that period, the highest of any state, with the JS-SEZ accounting for RM68 billion of it. Singapore was the largest single source at RM28.5 billion. That is not a housing story. It is an industrial story with housing attached. Speed two: high-rise residential Here the picture inverts. Johor Bahru had 108,863 existing serviced apartment units as at the first quarter of 2026, with a further 60,544 units under construction or planned through 2030 to 2031. That is a pipeline worth more than half the standing stock, arriving into a market where the demand case is largely forward-looking. CIMB Securities has kept a neutral rating on the property sector specifically on this basis, favouring industrial and landed exposure while flagging oversupply risk in JB high-rise. If you are looking at specific projects rather than the market as a whole, our guide to developments near the RTS Link breaks down the individual addresses. Is Johor Bahru high-rise in a bubble? You will hear this argued both ways with equal confidence. Here is the honest version. The bear case New launches near the RTS have been marketed at around RM1,500 per sq ft. The median transacted price for subsale property in the same area sits just below RM900 per sq ft. More pointedly, transactions above RM1,000 per sq ft made up less than 0.1% of Johor Bahru high-rise deals across 2024 and 2025. The bear reading is straightforward. When launch pricing detaches this far from the secondary market, and supply is set to expand sharply at the same time, you have the conditions that produced the Iskandar Puteri correction between 2013 and 2023. The bull case The price gap with Singapore is not a marketing line, it is arithmetic. The average residential price in Johor was RM487,128 in the first quarter of 2026. The average resale HDB flat in Singapore was around RM2.1 million. Even after Malaysia doubled foreign-buyer stamp duty in January 2026, the saving is large enough to absorb the additional tax comfortably. Our reading The Socio-Economic Research Centre found no apparent sign of an overheating bubble despite some speculative buying, while noting the need for supply and demand alignment and better price transparency. Ground-level data supports the calmer view. Olive Tree Property Consultants found Johor Bahru prices broadly stable through the first quarter of 2026, with selective rather than broad-based increases. Landed schemes moved modestly, with a double-storey terrace in Taman Molek rising to RM1.1 million from RM980,000 and Horizon Hills moving from RM800,000 to RM820,000. Both camps are right about different things. Landed and mass-market Johor is stable and fundamentally supported. A specific slice of RTS-adjacent new-launch high-rise is priced for an outcome that has not happened yet. Treat those as two markets, and most of the confusion disappears. The mistake is treating Johor as one market. Landed housing and industrial land are being driven by real occupiers and real investment approvals. A narrow band of high-rise product near the RTS is being priced on expectation. Investors who separate the two will do well. Investors who do not are taking industrial-grade risk for residential-grade returns.Kashif Ansari, Co-Founder and Group CEO, Juwai IQI What incentives apply under the JS-SEZ, and who qualifies? If you are assessing an entry rather than reading for interest, this is the section that matters. IncentiveWhat it offersApplies toSpecial corporate tax rate5% for up to 15 yearsNew investments in qualifying high-value activitiesInvestment tax allowance100% on qualifying capital expenditureQualifying capital investmentStamp duty exemptionFull exemptionCommercial property transactionsAccelerated capital allowanceFaster write-downRenovation expenditureFlat personal income tax15% for 10 yearsEligible knowledge workersFast-track approvalsManufacturing licences within seven daysApplications through IMFC-J The talent layer matters too, and it is often overlooked in property analysis. The zone targets 20,000 high-skilled jobs over five years, and the Johor Talent Development Council has set premium minimum salaries of RM4,000 for diploma holders and RM5,000 for Malaysian Skills Certificate holders at degree equivalent. Those wage floors are the mechanism that turns investment approvals into housing demand. Approvals alone do not fill units. Salaries do. For the wider zone background, see our overview of JS-SEZ investment opportunities. What is the real constraint on Johor's industrial story? Not demand. Power. Johor approved 51 data centre projects worth RM182.96 billion as at November 2025, of which 17 were operational, 11 under construction and 23 approved but not yet started. Wood Mackenzie's assessment is that Johor's data centres could consume 40% of the state's electricity demand by 2035, an increase of roughly 24 percentage points. Their framing is the one to hold onto: the question is increasingly about where power is available rather than whether it is available. The arithmetic is tight. Johor has around 6.8 GW of installed generation capacity, mostly gas and coal, with 2.1 GW of coal-fired plant due to retire in the 2030s. Fitch Ratings reaches the same conclusion from the credit side, noting that growth in both Singapore and Johor will be shaped more by infrastructure readiness than by demand, and that new projects face greater delay risk from power availability, grid upgrades and equipment lead times. Image source: StarProperty Why this matters for property specifically The RM150 per sq ft industrial land figure rests on data centre bidding. If grid readiness caps new approvals, and Johor's existing freeze on water-intensive Tier 1 and Tier 2 facilities stays in place, the marginal buyer for industrial land thins out. There is a second-order effect worth planning for. The construction cycle peaks before occupancy does. Major Johor data centre contracts currently run to completion dates of mid-2027, the fourth quarter of 2027 and the second quarter of 2028. Building these facilities employs many times more people than running them. If your rental thesis depends on data centre workers, know which phase you are underwriting. The handover from construction workforce to operational workforce happens inside your holding period. We looked at this in more depth in Malaysia's data centre boom and its impact on housing supply. Does the RTS Link change the cross-border maths? Yes, and the VEP increase is the underrated half of it. From 1 January 2027, foreign-registered cars entering Singapore pay S$50 a day instead of S$35, and motorcycles pay S$7 instead of S$4. That is a 43% increase for cars and 75% for motorcycles, landing in the same month the train opens. Samuel Tan, chief executive of Olive Tree Property Consultants, has argued that this looks like a deliberate push to move daily commuters onto the RTS rather than driving across the Causeway, and that it should support demand for homes near RTS stations as commuters start prioritising accessibility. He has also made the structural argument we find most persuasive, comparing the JS-SEZ to the Hong Kong and Shenzhen model, with Singapore providing financial and headquarters functions while Johor provides land and labour at lower cost. On his reading, the transit network is what makes that twinning model workable. What a cross-border buyer is really comparing Run your own numbers rather than trusting a brochure. The calculator below handles the repayment side. Estimates for guidance only. Actual figures depend on the bank's assessment, current rates, and your full financial profile. The difference between the right Johor asset and the wrong one is about two kilometres. Catchment, tenure, completion year and competing supply decide the outcome long before the market does. An IQI adviser will walk you through the specific asset you are considering, with the transaction data behind it. Speak to our Johor market team > Or review the pipeline directly: new launches and land. Our assumptions Every forecast rests on things that may not happen. Here are ours, stated plainly so you can stress-test them against your own view. The RTS Link opens on or close to 1 January 2027 and reaches meaningful daily ridership within the first two quarters. The JS-SEZ master plan is launched in December 2026 and published in enough detail to guide capital allocation. No further change to foreign-buyer stamp duty or RPGT in Belanjawan 2027. The overnight policy rate stays broadly where it is through 2027. Johor's freeze on water-intensive data centre categories remains, but AI-related approvals continue. Feeder transit, whether ART or APM, is still not operational during 2027. If two or more of these break, the base case below no longer holds. Base, bull and bear: three scenarios for 2027 BearBaseBullTriggerMaster plan slips again, RTS ridership undershoots, grid constraints stall industrial approvalsRTS opens on time, master plan lands in December, feeder transit still absentMaster plan lands with detailed zoning, RTS ridership beats projections, feeder transit fundedLanded residentialFlatModest, selective growthBroad-based growth in RTS and ART catchmentsHigh-rise, RTS catchmentNew-launch pricing corrects toward subsale levelsSharp split between walkable and non-walkable addressesRental absorption validates current launch pricingHigh-rise, wider JBRising overhang, rental compressionSoft, competing with the completion pipelineSpillover demand lifts the second ringIndustrial landPlateau as data centre bidding slowsHolds near current levelsContinues climbing on fresh AI-linked approvals We hold the base case. Our reading is that 2027 delivers selective strength rather than a broad rally, and that the genuine test arrives in 2028, when the construction cycle rolls off and the high-rise completion wave meets the market at the same time. What does this mean for you? If you are an institutional or industrial investor Power availability is your diligence priority, not land price. Confirm the substation position, the grid connection timeline and the energy supply agreement status before you underwrite the land. Wood Mackenzie's point about location-specific grid pressure is the operative risk. If you are a developer holding Johor landbank The landed and industrial-adjacent portions of your bank are working. The high-rise portion faces a 2028 to 2031 competition problem that is already visible in the pipeline data. Phasing decisions made in 2027 will matter more than pricing decisions. If you are a cross-border individual investor Walkability to Bukit Chagar is doing more work in the price than most buyers realise, and the feeder transit that would extend that catchment is not built yet. The second ring is cheaper for a reason that is real today and may not be real in 2029. That is a timing bet, so size it like one. Johor's fundamentals are the strongest they have been in a decade. That is exactly why discipline matters now. Infrastructure creates value over years, not over launch weekends, and the assets that reward patience are rarely the ones with the loudest marketing.Kashif Ansari, Co-Founder and Group CEO, Juwai IQI About this forecast. Prepared by Juwai IQI using research from CIMB Securities, Wood Mackenzie, Moody's Ratings, Fitch Ratings, the Socio-Economic Research Centre and Olive Tree Property Consultants. Figures as at 7 September 2026. Next scheduled review: after the JS-SEZ master plan launch in December 2026. This is general market commentary and not investment advice. Frequently asked questions When does the Johor Bahru to Singapore RTS Link open? Passenger service is scheduled to begin on 1 January 2027, connecting Bukit Chagar in Johor Bahru with Woodlands North in Singapore. The journey takes about five minutes and the system is designed for 10,000 passengers per hour in each direction, with roughly 40,000 riders a day expected at launch. When will the JS-SEZ master plan be released? It is expected to be launched in December 2026 at the Annual Leaders' Retreat, jointly by the Malaysian and Singaporean prime ministers. The launch has been postponed several times, having originally been expected by the end of 2025. Is Johor Bahru property in a bubble? It depends entirely on the segment. Landed and mass-market housing has been stable, with selective rather than broad price increases. A narrow band of new-launch high-rise near the RTS has been marketed at levels well above the subsale median in the same area, and that specific slice carries genuine correction risk. What tax incentives does the JS-SEZ offer? Qualifying high-value activities can access a special corporate tax rate of 5% for up to 15 years, a 100% investment tax allowance on qualifying capital expenditure, stamp duty exemption on commercial property transactions, accelerated capital allowance on renovation, and a flat 15% personal income tax rate for eligible knowledge workers over 10 years. How much supply is coming to the Johor Bahru high-rise market? Johor Bahru had 108,863 existing serviced apartment units as at the first quarter of 2026, with a further 60,544 units under construction or planned through 2030 to 2031. Will data centres keep driving Johor industrial land prices? Demand remains strong, but power is the constraint. Johor's data centres could consume 40% of state electricity demand by 2035, and grid readiness rather than investor appetite is likely to determine how many further projects proceed. Forecasts are useful. Transaction data is decisive. IQI tracks Johor transactions, completions and rental movement through Realtycheck, our own property data platform. Fill in your details below and one of our Johor agents will connect with you to discuss what the numbers actually say about the catchment you are looking at. Fill in your details below and our agent will be in touch. [custom_blog_form] Continue reading: Discover Johor’s 7 Most Richest Neighborhoods: Where Malaysia’s Southern Elite Choose to Live Guide to the Johor Real Estate Market Outlook (2025-2026) Johor and Klang Valley: A Growing Partnership or Rivalry? | Juwai IQI Earn in SGD With Your Property: Why Investing in the Johor-Singapore SEZ is a Smart Move! Johor Property Market is on Fire! Join as Real Estate Agent Now! References and sources: JS-SEZ – Steady as it goes, Lee Heng Guie, 7 January 2026 (https://www.thestar.com.my/business/insight/2026/01/07/js-sez---steady-as-it-goes) | The Star Johor govt urges immediate release of JS-SEZ master plan, edited by Presenna Nambiar, 2 July 2026 (https://theedgemalaysia.com/node/809167) | The Edge Malaysia JS-SEZ ready for next step, 1 August 2026 (https://www.thestar.com.my/news/nation/2026/08/01/js-sez-ready-for-next-step) | The Star Malaysia, Singapore to jointly launch JS-SEZ master plan in December, says Akmal Nasrullah, 31 July 2026 (https://www.malaymail.com/news/malaysia/2026/07/31/malaysia-singapore-to-jointly-launch-jssez-master-plan-in-december-says-akmal-nasrullah/229782) | Malay Mail Single permits key to unlocking JS-SEZ potential, September 2026 (https://www.nst.com.my/business/economy/2026/09/1525649/single-permits-key-unlocking-js-sez-potential) | New Straits Times CIMB Securities flags diverging outlook between asset classes in Johor, edited by Isabelle Francis, 16 July 2026 (https://theedgemalaysia.com/node/810909) | The Edge Malaysia The Edge Malaysia | Olive Tree Property Consultants Johor Bahru Housing Property Monitor 1Q2026: Remaining resilient amid geopolitical uncertainty, 5 June 2026 (https://theedgemalaysia.com/node/804728) | The Edge Malaysia Johor election won't hurt property market, 5 July 2026 (https://www.thestar.com.my/business/business-news/2026/07/05/johor-election-wont-hurt-property-market) | The Star State election unlikely to derail Johor home sales, June 2026 (https://www.nst.com.my/property/2026/06/1475943/state-election-unlikely-derail-johor-home-sales) | New Straits Times Equity market resilient despite Johor volatility, 14 July 2026 (https://www.thestar.com.my/business/business-news/2026/07/14/equity-market-resilient-despite-johor-volatility) | The Star ohor's data centres could consume 40% electricity demand by 2035, says WoodMac, edited by S Kanagaraju, 18 June 2026 (https://theedgemalaysia.com/node/807442) | The Edge Malaysia Powering Johor's Data Centre Boom: Supply, Demand, and Grid Constraints, Alvin Tan, June 2026 | Wood Mackenzie Singapore's low data centre rate to propel demand in Johor, 1 September 2026 (https://www.thestar.com.my/business/business-news/2026/09/01/singapores-low-data-centre-rate-to-propel-demand-in-johor) | The Star Kerjaya Prospek bags first data centre contract worth RM858 mil, edited by Jason Ng, 3 September 2026 (https://theedgemalaysia.com/node/816701) | The Edge Malaysia Sunway Construction bags RM664 mil variation orders, lifts Johor data centre contracts to RM865 mil, edited by Isabelle Francis, 18 June 2026 (https://theedgemalaysia.com/node/807321) | The Edge Malaysia IJM Corp unit secures RM1.4 bil data centre project in Johor, its biggest yet, edited by Presenna Nambiar, 15 August 2025 (https://theedgemalaysia.com/node/766764) | The Edge Malaysia Belanjawan 2027 perlu penuhi harapan rakyat, rancakkan pembangunan negara – PM Anwar (https://mof.gov.my/portal/ms/berita/akhbar/belanjawan-2027-perlu-penuhi-harapan-rakyat-rancakkan-pembangunan-negara-pm-anwar) | Kementerian Kewangan Malaysia Belanjawan Johor 2026: Kerajaan negeri peruntuk RM2.546 bilion (https://berita.rtm.gov.my/nasional/senarai-berita-nasional/senarai-artikel/belanjawan-johor-2026-kerajaan-negeri-peruntuk-rm2-546-bilion/) | RTM Berita Johor's economic boost to reach all districts, says MB, March 2026 (https://www.nst.com.my/business/economy/2026/03/1395266/johors-economic-boost-reach-all-districts-says-mb) | New Straits Times

Asia’s Property Investment Map Is Changing International property investors have traditionally focused on established markets in Europe and the Middle East, but Asia is increasingly moving onto the radar. Across the region, economic growth, infrastructure expansion, tourism and the development of new business hubs are creating fresh property opportunities. In Indonesia, Bali remains a major lifestyle market, while infrastructure investment, the development of Nusantara and new International Financial Centres are broadening the country’s investment story. Vietnam continues to strengthen its position as a manufacturing hub, supported by highways, metro systems and the new Long Thanh International Airport. This is creating potential opportunities beyond Ho Chi Minh City and Hanoi, particularly in areas benefiting from infrastructure and industrial growth. Where Else Should Investors Look? Thailand remains one of Southeast Asia’s most established international property markets. Phuket and Koh Samui are attracting second-home and lifestyle buyers, while Bangkok continues to offer scale and a mature luxury property segment. In Malaysia, Johor stands out. The Johor-Singapore Special Economic Zone and Forest City’s designation as a Special Financial Zone could support future business activity, employment and housing demand. The Philippines also presents selective opportunities. While parts of Metro Manila face significant condominium supply, regional markets such as Cebu and Clark may offer stronger potential where infrastructure, tourism, business activity and population growth align. Outlook There is no single best market across Asia. The stronger opportunities are likely to be found by following infrastructure, business expansion, tourism and population growth, rather than simply investing at a country level. For investors, the key is selectivity. Indonesia, Vietnam, Thailand, Malaysia and the Philippines each offer different strengths, but the most compelling opportunities will depend on choosing the right location within each market and understanding what is driving future demand. The contents of this article were contributed by Taco Heidinga, Global Real Estate Strategist, Juwai IQI; Country Head, IQI Bali & Lombok; Founder, Homes in Asia. Download to see insights from other country marketsDownload
Ready to get started?
Get in touch now.