

Team Leader (Subsales) ∙ United
Wee Yu Chwern
REN07383
About Wee Yu Chwern
Leveraging market knowledge and negotiation skills to deliver exceptional results. Your real estate success is my priority. Ready to make your real estate dreams a reality? Let's chat. Your dream home awaits.
5 years at IQI
149 transactions
3 properties on sale
28 properties on rent
Contact Wee Yu Chwern
Wee Yu Chwern Social Links
Wee Yu Chwern's Service Locations
Wee Yu Chwern's Service Locations
My Listings
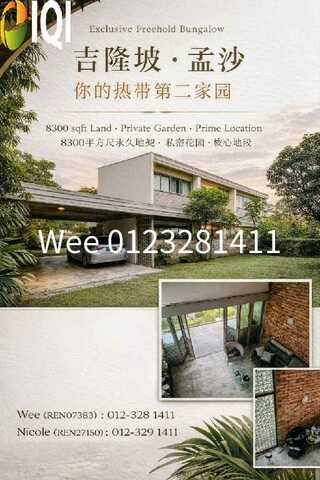
Bukit Bandaraya
Lorong Pantai
$ 1,963,080 /month
Listed on March 30, 2026
Wisma RKT
No. 2, Jalan Raja Abdullah, 50300 Dang Wangi
$ 3,741 /month
Listed on August 3, 2026
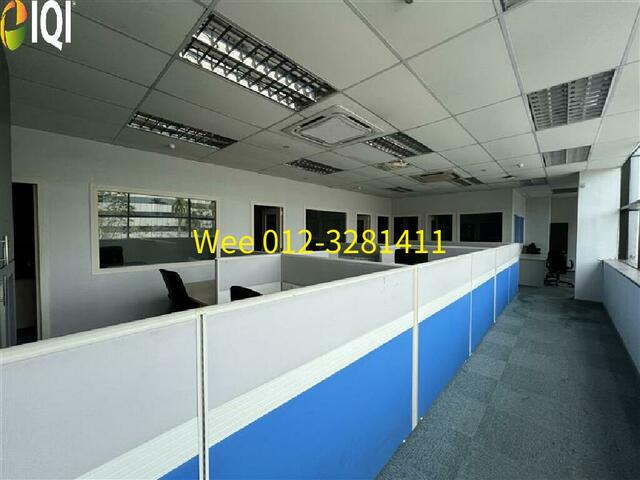
Hicom Glenmarie
Persiaran Kerjaya, U1, 40150 Shah Alam
$ 9,643 /month
Listed on August 4, 2025
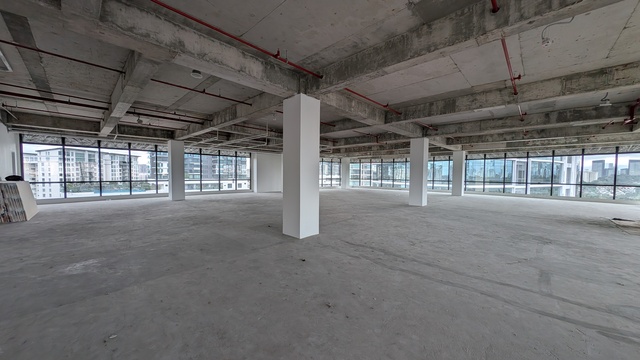
Union Tower
Union Tower, Taman Desa, 58000, Kuala Lumpur
$ 7,757 /month
Listed on October 28, 2025
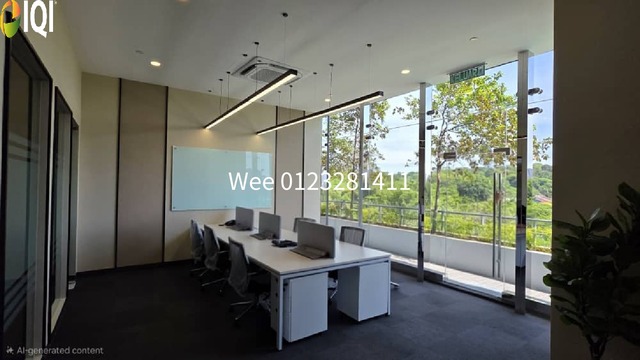
Union Tower
Union Tower, Taman Desa, 58000, Kuala Lumpur
$ 3,093 /month
Listed on March 30, 2026

Endah Ria
Endah Ria Condo, Jalan 3/149E, Taman Sri Endah
$ 130,872 /month
Listed on March 30, 2026
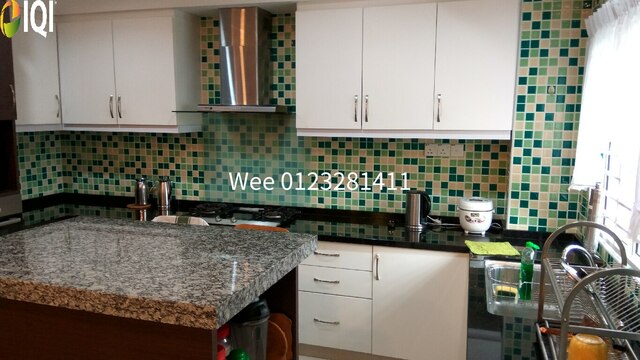
Bangsar Ria
Jalan 1/80b
$ 464,940 /month
Listed on March 30, 2026
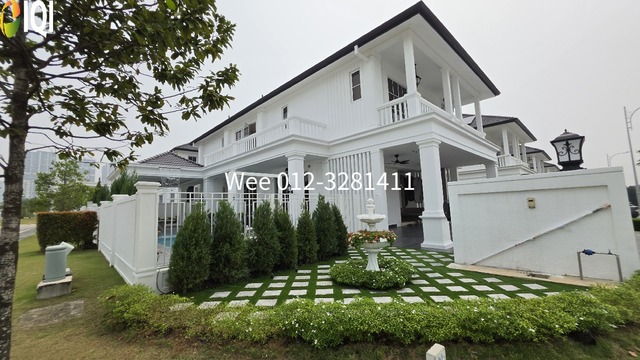
Stoneridge @ Eco Majestic
Stoneridge @ Eco Majestic, Semenyih, Selangor
$ 1,363,824
Listed on October 19, 2026

Union Tower
Union Tower, Jalan Desa Bakti
$ 63,011,424 /month
Listed on March 30, 2026
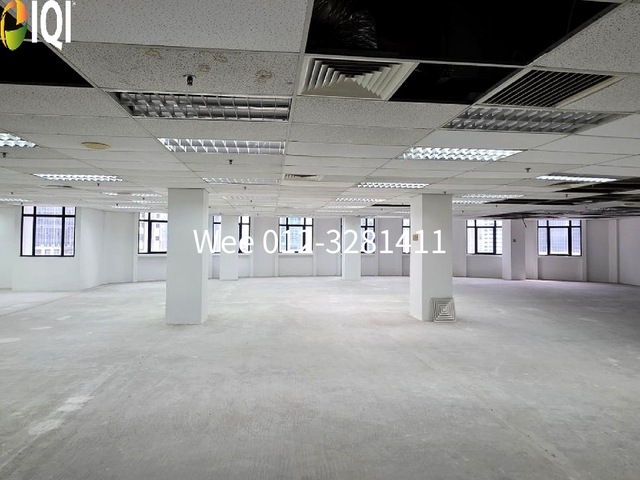
Wisma UOA II
No 21, Jalan Pinang, 50450 Kuala Lumpur
$ 8,622 /month
Listed on September 17, 2026
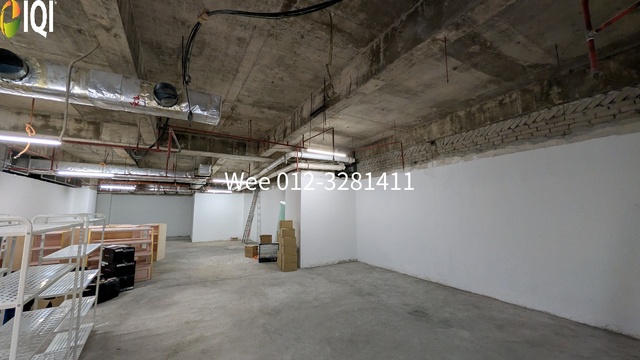
Wisma Masalam
1, Jalan Tengku Ampuan Zabedah C/9c, Seksyen 9, 40100 Shah Alam, Selangor
$ 4,822 /month
Listed on August 2, 2026
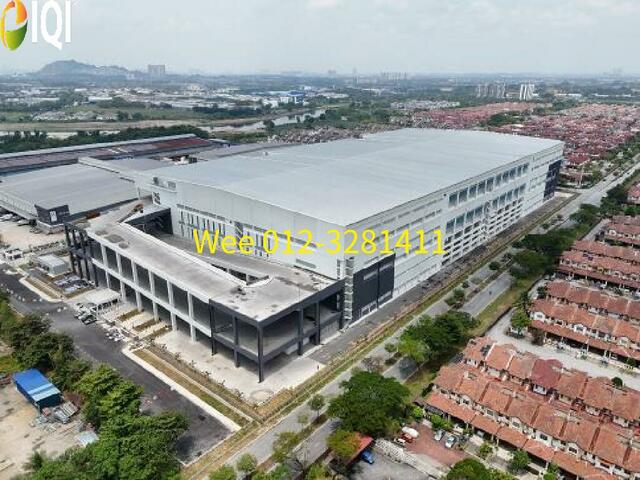
Seksyen 33
Shah Alam Seksyen 33
$ 113,828 /month
Listed on August 15, 2025
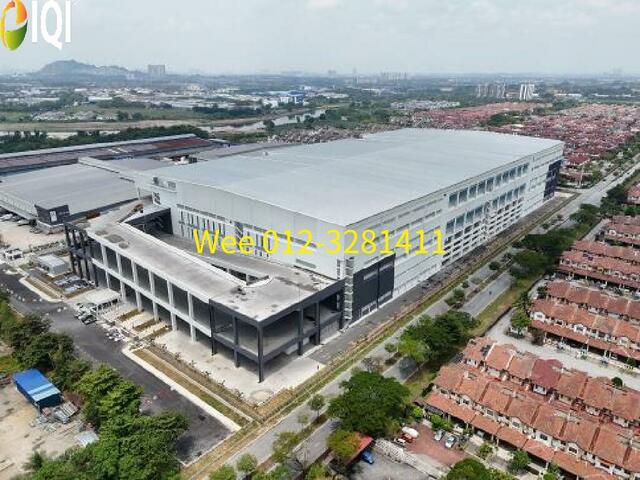
Seksyen 33
Shah Alam Seksyen 33
$ 361,620
Listed on August 15, 2025
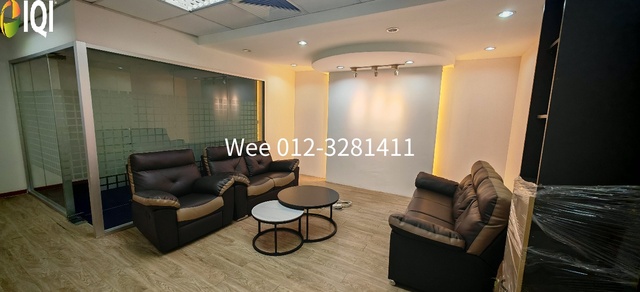
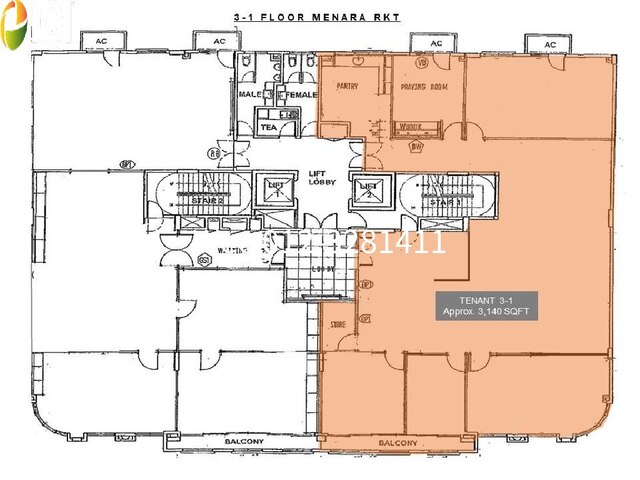
Menara RKT
36, Jalan Raja Abdullah, Off, Jln Sultan Ismail, 50300 Kuala Lumpur
$ 4,360 /month
Listed on August 3, 2026

Union Tower
Union Tower, Jalan Desa Bakti
$ 62,956,320 /month
Listed on March 30, 2026

Plaza Sentral
Jalan Stesen Sentral 5, KL Sentral
$ 18,253 /month
Listed on October 13, 2025
Hicom Glenmarie
Persiaran Kerjaya, U1, 40150 Shah Alam
$ 4,133 /month
Listed on August 4, 2025
Hicom Glenmarie
Persiaran Kerjaya, U1, 40150 Shah Alam
$ 964 /month
Listed on August 4, 2025
Hicom Glenmarie
Persiaran Kerjaya, U1, 40150 Shah Alam
$ 23,092 /month
Listed on August 4, 2025
Section 51A
Section 51A, Petaling Jaya
$ 2,841 /month
Listed on August 4, 2025
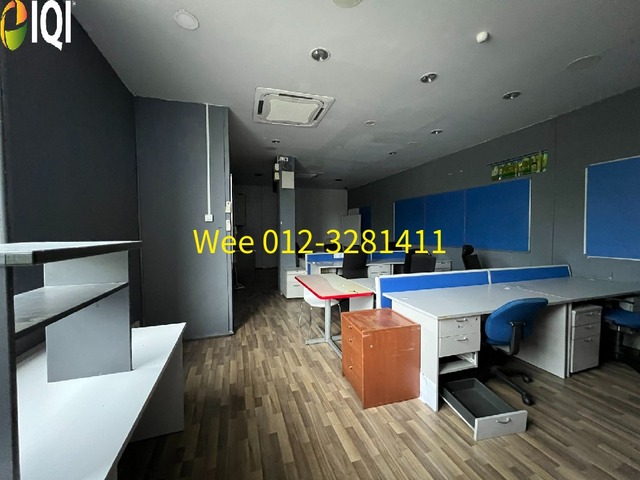
Hicom Glenmarie
Persiaran Kerjaya, U1, 40150 Shah Alam
$ 7,749 /month
Listed on August 4, 2025

Plaza Sentral
Jalan Stesen Sentral 5, KL Sentral
$ 21,697 /month
Listed on October 13, 2025
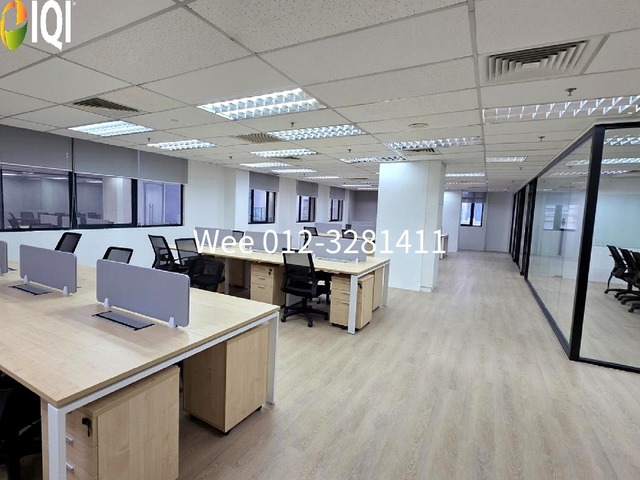
Wisma UOA II
No 21, Jalan Pinang, 50450 Kuala Lumpur
$ 5,946 /month
Listed on September 25, 2026

The Exchange 106 @ TRX
Persiaran TRX
$ 8,644 /month
Listed on August 3, 2026

Sri Petaling Endah Ria Renovated 3 Bedrooms Condominium for SALE RM360k
Sri Petaling Endah Ria Renovated 3 Bedrooms Condominium for SALE RM360k
$ 123,984
Listed on May 1, 2024
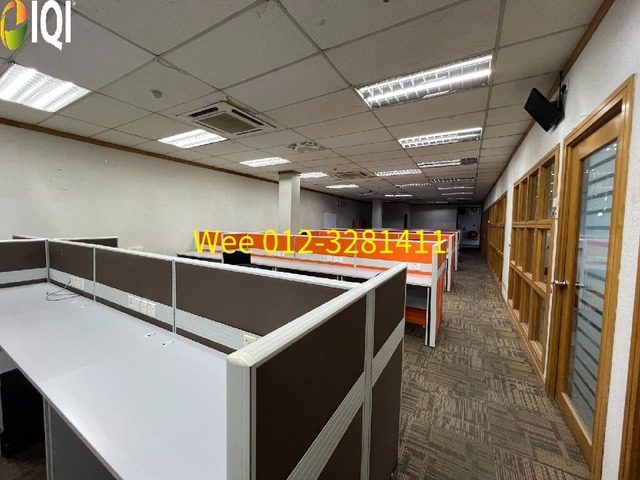
Hicom Glenmarie
Persiaran Kerjaya, U1, 40150 Shah Alam
$ 7,353 /month
Listed on August 4, 2025
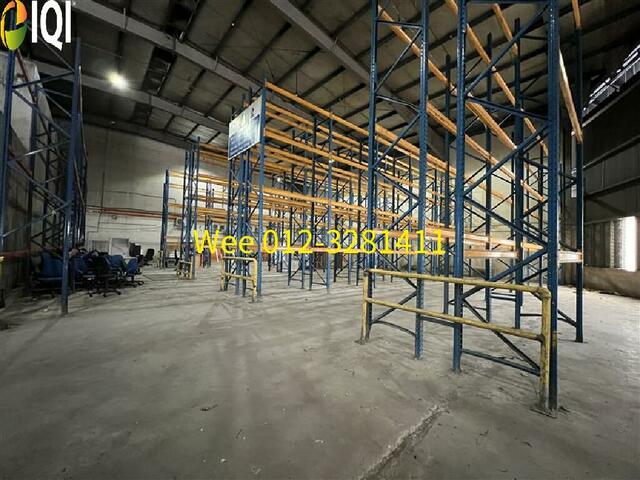
Hicom Glenmarie
Persiaran Kerjaya, U1, 40150 Shah Alam
$ 4,339 /month
Listed on August 4, 2025
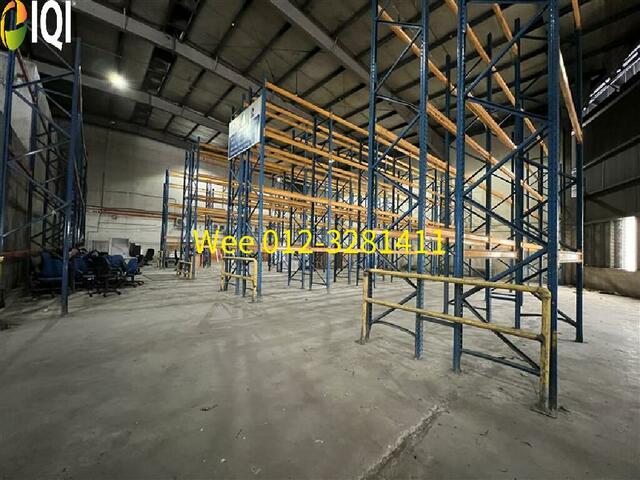
Hicom Glenmarie
Persiaran Kerjaya, U1, 40150 Shah Alam
$ 4,443 /month
Listed on August 4, 2025
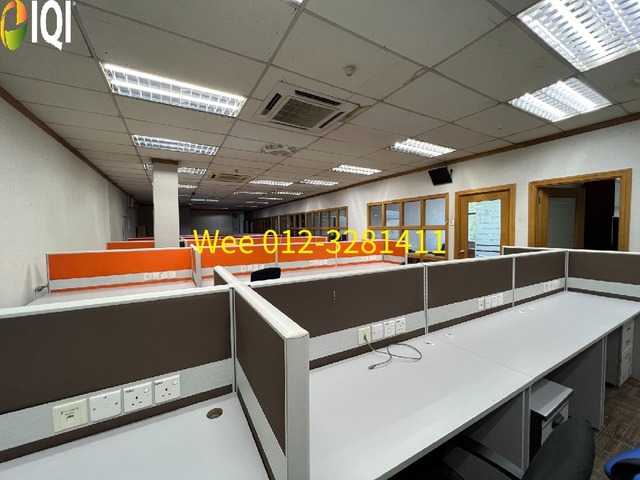
Hicom Glenmarie
Persiaran Kerjaya, U1, 40150 Shah Alam
$ 4,219 /month
Listed on August 4, 2025
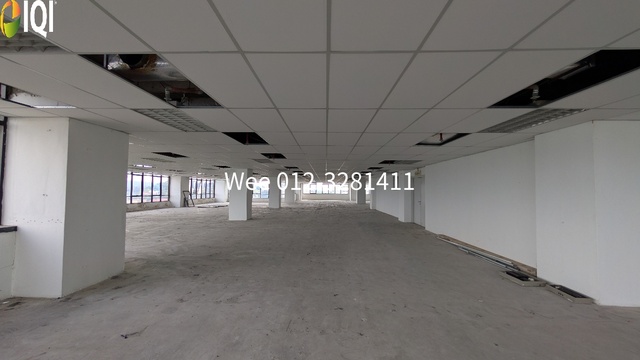
Wisma Masalam
1, Jalan Tengku Ampuan Zabedah C/9c, Seksyen 9, 40100 Shah Alam, Selangor
$ 20,841 /month
Listed on August 2, 2026
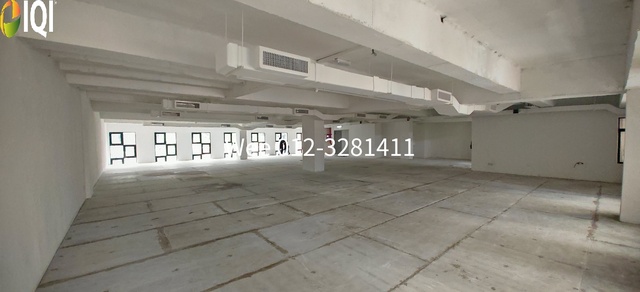
Wisma RKT
No. 2, Jalan Raja Abdullah, 50300 Dang Wangi
$ 3,548 /month
Listed on August 3, 2026
Our newly launched projects
Discover the real estate properties in and around Kuala Lumpur, Malaysia. Buy apartment units, landed houses, bungalows, commercial office space, shop lots, and sub-sales with 100% confidence at IQI Global.
 Located in Kubang Semang
Northern TechValley @BKE
Mukim 14, Kubang Semang, 14400 Seberang Perai, Penang, Malaysia
Starting from $ 4,992,257
Listed on January 23, 2026
 Varied built-up sizes
Taman IKS Bukit Minyak
Jalan IKS Bukit Minyak Utama, Taman IKS Bukit Minyak, 14100 Simpang Ampat, Penang, Malaysia.
Starting from $ 414,589
Listed on January 23, 2026
 Located in Simpang Ampat
Regalway Industrial Hub (Industrial)
Regalway Industrial Hub, Off Jalan Bukit Panchor, Bukit Panchor, 14100 Simpang Ampat, Penang, Malaysia.
Starting from $ 1,727,166
Listed on January 23, 2026
 Spacious land area
Taman Jasa Ria (Garden Villa)
Jalan Permatang Pasir, Taman Jasa Ria, 14000 Bukit Mertajam, Penang, Malaysia
Starting from $ 385,315
Listed on January 23, 2026
 Located in Bukit Mertajam
Taman Jasa Intan (Garden Superlink)
Jalan Jasa Intan, Taman Jasa Intan, 14000 Bukit Mertajam, Penang, Malaysia
Starting from $ 281,719
Listed on January 23, 2026
 Large land area
Taman Fajar Permai (Sunrise Terrace)
Jalan Fajar, Taman Fajar Permai, 14300 Nibong Tebal, Penang, Malaysia.
Starting from $ 189,420
Listed on January 23, 2026
Mortgage Calculator
Calculate your estimated month repayment and plan your monthly expenses well.
The mortgage calculator is intended for reference only. Actual amount may vary.
Monthly Payment
Send me the mortgage calculator result

Home Loan Eligibility Calculator
Calculate your potential loan amount and assess your home buying affordability.

Rental Yield
Calculate the potential rental yield and evaluate a property's investment performance.

Down Payment Saving Plan
Create a structured savings plan and determine how much to save monthly for your down payment plan.

Malaysian Property Transaction Fees Calculator
Estimate the total transaction fees and budget accurately for your Malaysian property purchase.
IQI blog & news
Articles specifically curated for your daily digest of local and global real estate news.

National Market Remains Under Pressure Canada’s housing market remained subdued in August 2026, with national home prices down 3.3% year-on-year. High borrowing costs, economic uncertainty and weaker buyer demand continued to weigh on activity, although sales showed some early signs of stabilisation. In the Greater Toronto Area, new listings fell 14.1% year-on-year, while sales declined 2.1%. The reduction in available homes is limiting buyer choice and increasing competition in selected areas. The average selling price stood at $993,410, down 2.7%, while the benchmark price declined 4.5%. Despite weaker prices, tightening inventory and improving economic conditions could provide support for the Toronto market, with price growth potentially returning if demand strengthens in the coming months. Vancouver Faces Ample Supply and Softer Demand Metro Vancouver also remained soft, with sales falling 4.6% year-on-year and sitting 20.7% below the 10-year seasonal average. New listings declined 3%, although overall inventory remained 26.2% above the 10-year average, giving buyers relatively broad choice. Slower sales continued to pressure values, with the benchmark home price declining 5.6% year-on-year to $1.082 million. Detached homes and apartments experienced sharper price declines, while townhouse sales showed slightly stronger resilience. Outlook Canada’s housing market is likely to remain selective and price-sensitive in the near term. Toronto’s tightening inventory may support gradual stabilisation, while Vancouver continues to favour buyers through higher inventory and softer pricing. A broader recovery will depend on improved affordability, stronger confidence and a sustained improvement in housing demand. The contents of this article were contributed by Yousaf Iqbal, Head of IQI Canada. Download to see insights from other country marketsDownload
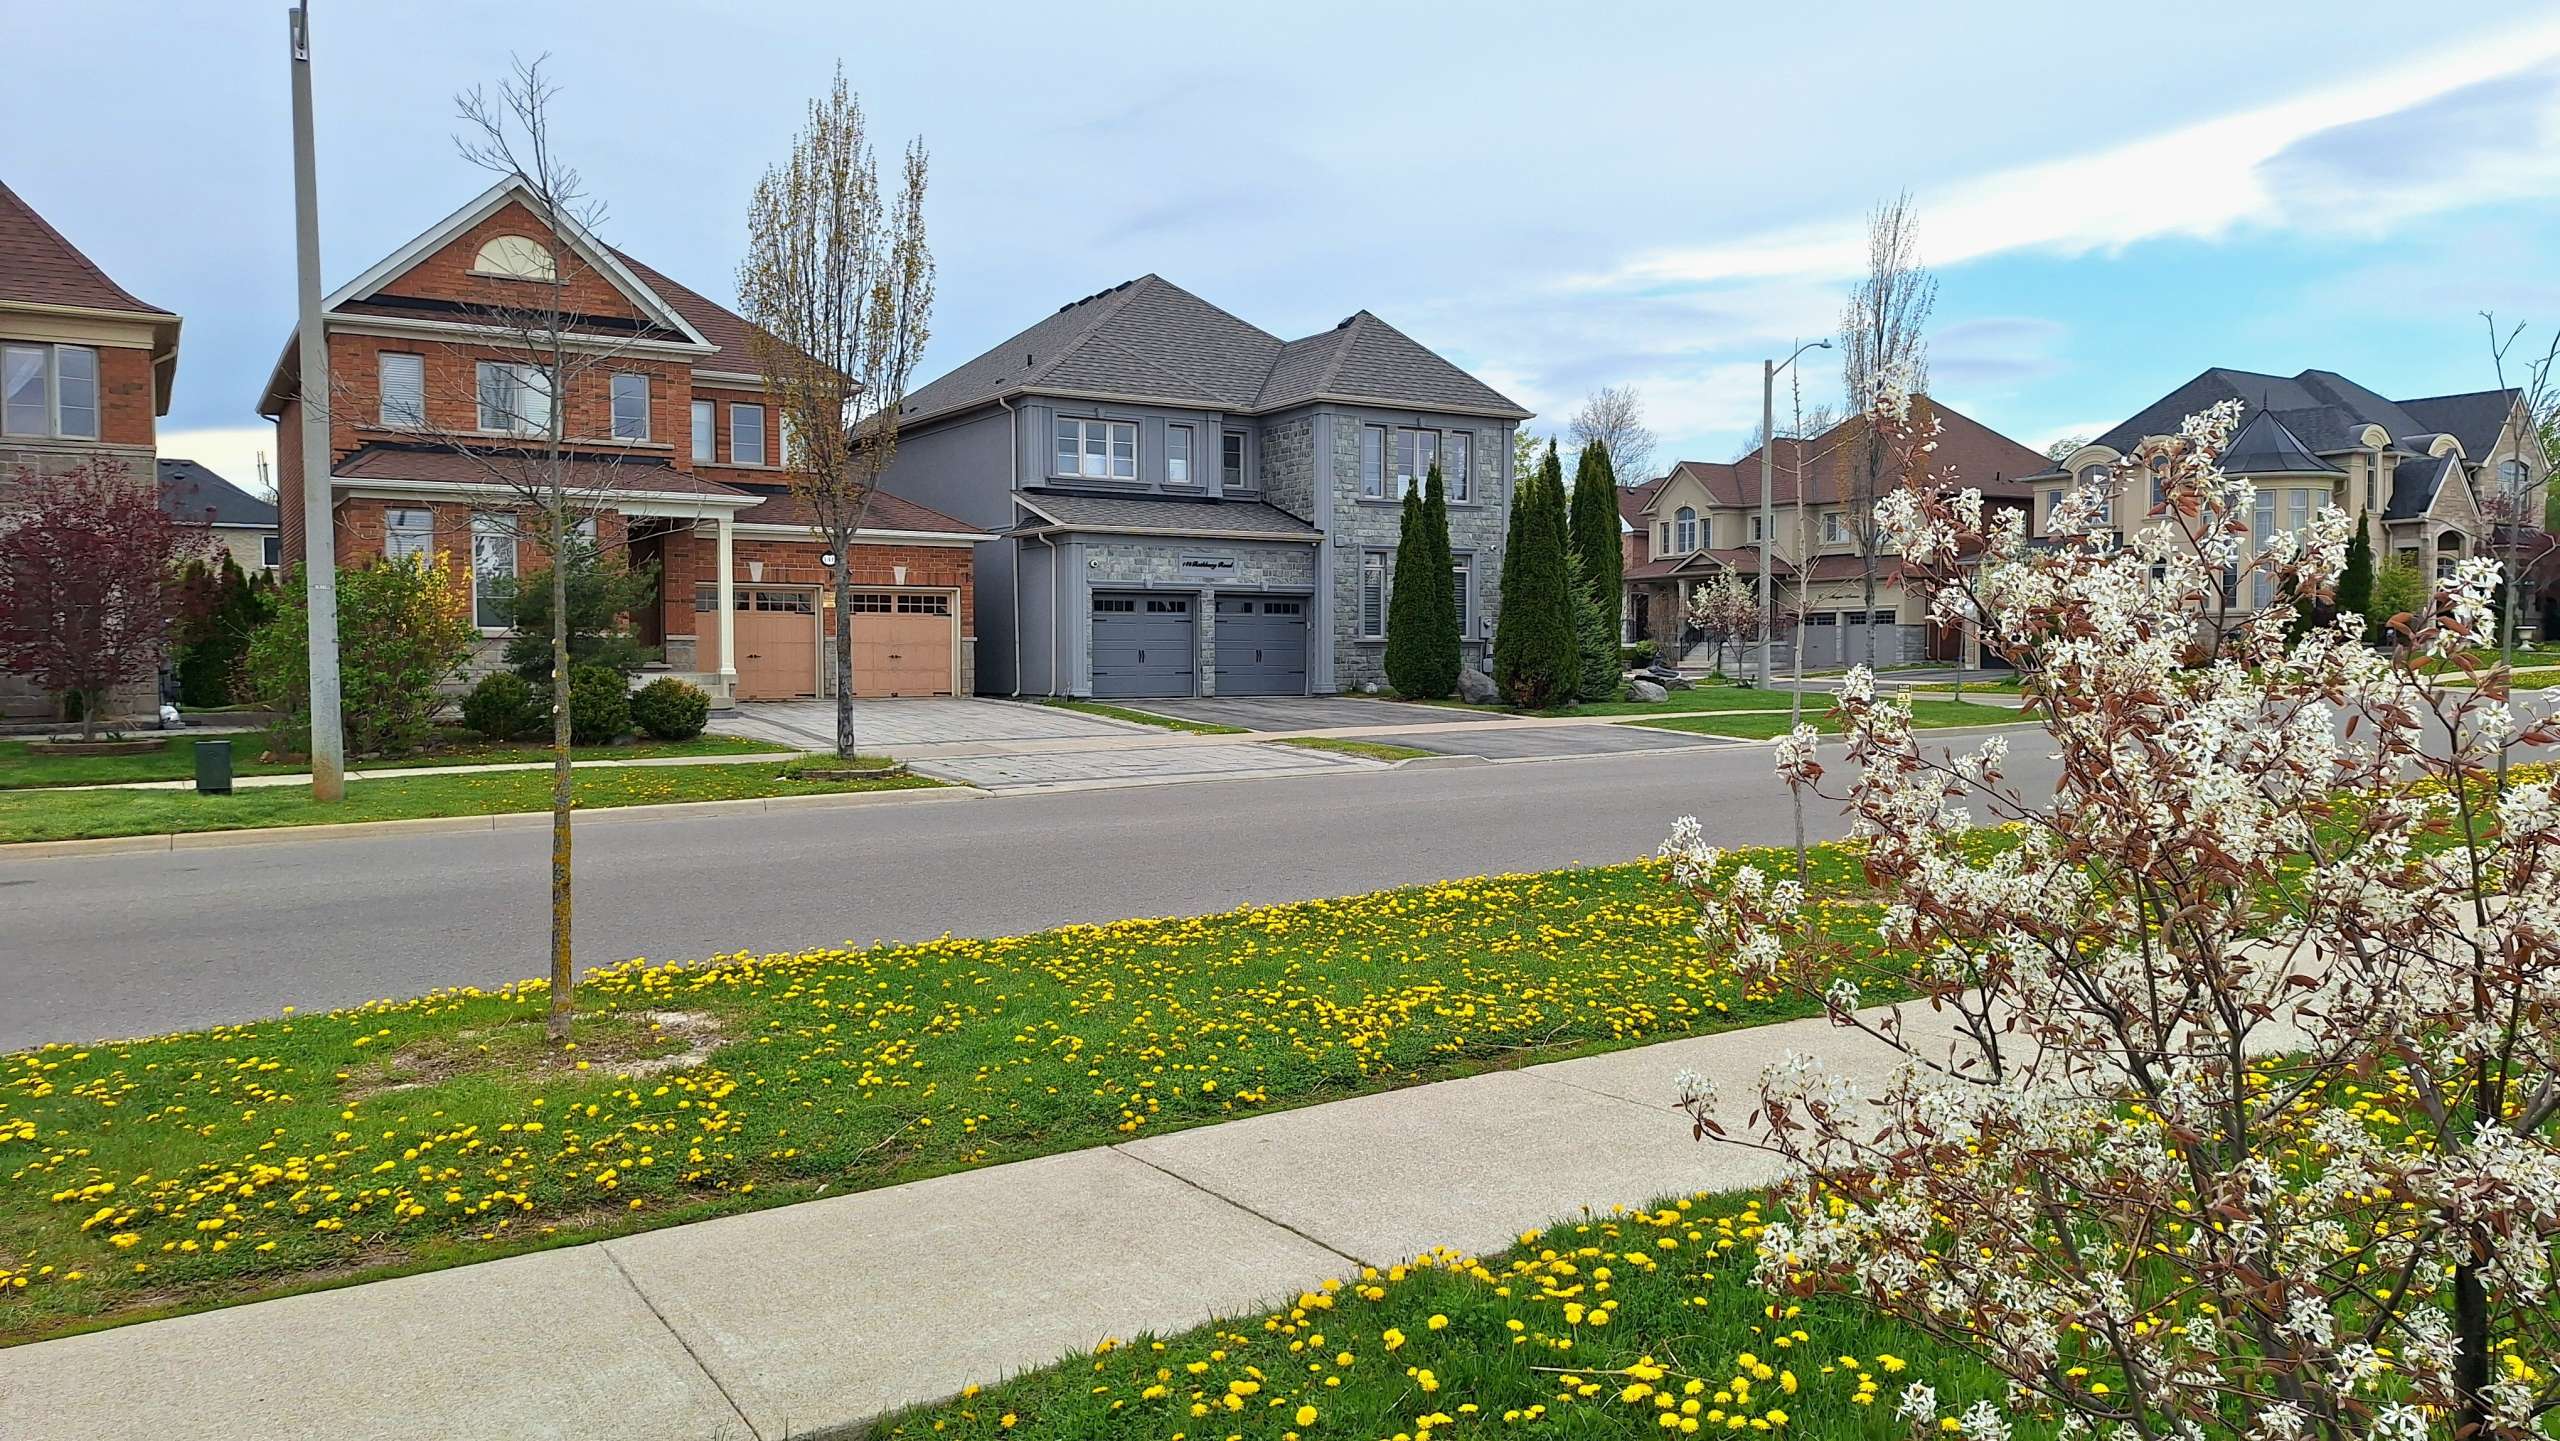
Major Markets Lose Momentum Canada’s housing market remained relatively balanced in July 2026, as buyers stayed cautious despite improved borrowing conditions. Sales and new listings slowed across major markets, while prices continued to soften in several regions. In the Greater Toronto Area, sales fell 0.9% year-on-year, while new listings dropped a much sharper 17.8%. The average selling price declined 4.5% to C$1,003,956, although reduced supply has begun increasing competition among buyers. Metro Vancouver also slowed, with home sales falling 9.8% year-on-year to 2,061 transactions. New listings declined 11.5%, while the composite benchmark price fell 6.2% year-on-year to C$1,088,800. Apartment sales recorded the largest drop, down 17.8%. Quebec Shows a Different Pattern Quebec also experienced softer transaction activity, with total sales down 6% year-on-year in July. However, active listings increased 19%, giving buyers more choice. Price trends were more mixed. The median price for single-family homes increased 3% to C$505,000, while plex properties recorded an 8% increase to C$690,000. Condominium activity was weaker, with sales falling 16% and median prices edging down 1%. The figures highlight how Canada’s housing adjustment is increasingly varying by region and property type. Outlook Canada’s market is likely to remain balanced but selective in the near term. Toronto and Vancouver may continue facing price pressure as demand adjusts, although tighter new supply could provide some support. For buyers and investors, opportunities will increasingly depend on local inventory, property type and pricing, rather than broad national market trends. The contents of this article were contributed by Yousaf Iqbal, Head of IQI Canada. Download to see insights from other country marketsDownload

29 Jul, 2026
Canada Housing Market Outlook 2026: Buyer Activity Strengthens in Toronto and Vancouver
Canada’s Housing Market Regains Momentum Canada’s housing market strengthened in June 2026 as lower borrowing costs, improving affordability and growing consumer confidence encouraged more buyers to return. The recovery was particularly visible in Toronto and Vancouver, where sales increased while the supply of newly listed homes declined. This combination points to improving demand, although market conditions remain different across provinces and property types. Toronto and Vancouver Lead the Recovery The Greater Toronto Area recorded 6,770 home sales, representing a 9.4% year-on-year increase. At the same time, new listings fell 12.9%, while active listings declined 13.5%. Toronto’s average home price reached $1,058,658, down 3.9% year-on-year. This suggests buyers are returning to the market, but price sensitivity continues to shape purchasing decisions. Metro Vancouver also recorded renewed momentum. Residential sales rose 9.6% year-on-year to 2,390 transactions, while new listings decreased 6.0%. Demand strengthened across detached homes, townhouses and apartments. Apartments generated the highest number of sales at 1,103 transactions, with a benchmark price of $695,200. Quebec presented a more mixed picture. Total residential sales declined 4% year-on-year to 8,492, while active listings increased 18%. However, median prices remained resilient, with single-family homes rising 3% to $515,000and condominiums increasing 1% to $409,500. Outlook Canada’s housing recovery is likely to remain gradual and regionally uneven. Toronto and Vancouver may continue benefiting from stronger buyer confidence and tighter new supply. However, buyers are expected to remain selective, especially where affordability remains challenging. Markets with balanced pricing, improving financing conditions and limited inventory should be better positioned to maintain momentum through the second half of 2026. Download to see insights from other country marketsDownload

Canada Housing Market Shows Improving Stability Canada’s housing market continued to stabilise in May 2026, with buyer activity gradually strengthening across many regions. Lower borrowing costs, improving affordability and stronger homebuyer confidence supported greater market participation during the spring season. Nationally, conditions remained relatively balanced. Inventory levels continued to give buyers ample choice, while home prices generally stayed below year-ago levels. This helped keep affordability in focus and prevented competition from rising too quickly. However, tightening supply in selected markets and improving sales activity suggest that Canada’s housing market may be moving closer to equilibrium. Toronto Gains Momentum, Vancouver Remains Balanced The Greater Toronto Area showed stronger momentum in May. Home sales increased 6.3% year-on-year to 6,583 transactions, while new listings fell 18.9% compared with May 2025. Even as market conditions tightened, buyers still benefited from softer pricing. The MLS® HPI Composite benchmarkwas down 6.7% year-on-year, while the average selling price reached $1,069,700, down 4.6% from a year earlier. In Metro Vancouver, the market remained more balanced. Residential sales totalled 2,150 transactions, down 3.5% year-on-year, while new listings declined 7.6%. Inventory remained elevated, with active listings more than 34% above the region’s 10-year average. The benchmark price for all residential properties stood at $1,100,700, down 6.2% year-on-year, giving buyers more selection and keeping price growth contained. Outlook Canada’s housing market is expected to move toward steadier conditions in the coming months. If buyer demand continues to recover and supply tightens further in key cities, price declines may moderate. For buyers, the current market still offers choice and negotiating room. For sellers, improving activity is positive, but realistic pricing remains essential. Download to see insights from other country marketsDownload
Ready to get started?
Get in touch now.
