

Team Leader (Subsales) ∙ United
Janie Wai
REN57935
Team Leader (Subsales) ∙ United
Janie Wai
REN57935
About Janie Wai
Hi, I’m Janie Wai from IQI Realty Malaysia 👋📞 +6017-230 5637WeChat: jwyl20 Registered Real Estate Negotiator focusing on commercial and industrial properties in Selangor & Kuala Lumpur. I support business owners and investors in finding suitable premises efficiently, with clear advice and end-to-e... Hi, I’m Janie Wai from IQI Realty Malaysia 👋📞 +6017-230 5637WeChat: jwyl20 Registered Real Estate Negotiator focusing on commercial and industrial properties in Selangor & Kuala Lumpur. I support business owners and investors in finding suitable premises efficiently, with clear advice and end-to-end assistance,from site selection, evaluation, negotiation, to completion.Property Types: Commercial | Industrial | Land.Feel free to contact me if you are planning expansion, relocation, or investment.I look forward to assisting you.⸻您好, 我是Janie Wai , 来自 IQI Realty Malaysia.📞 +6017-230 5637 . 微信: jwyl20注册房地产谈判员,专注于雪兰莪与吉隆坡的商业与工业地产。我协助企业主与投资者高效寻找合适的物业,提供清晰专业的建议及一站式服务 —— 从选址评估、谈判到完成交易,全程跟进。 物业类型: 办公室 | 工厂 | 仓库 | 土地 | 如果您正计划扩展业务、搬迁或投资,欢迎随时联系我。期待为您服务。
4 years at IQI
98 transactions
4 properties on sale
14 properties on rent
Contact Janie Wai
Janie Wai's Service Locations
Janie Wai's Service Locations
My Listings

KOTA PUTERI, BANDAR BATU ARANG
Kota Puteri, Jln Kota Puteri, 48100 Batu Arang
$ 22,750 /month
Listed on March 2, 2026

Port Klang Free Zone
Port Klang, 42920 Pulau Indah, Selangor
$ 59,500 /month
Listed on April 4, 2024

Jalan Bukit Bintang
Jalan Bukit Bintang
$ 21,912 /month
Listed on March 19, 2025
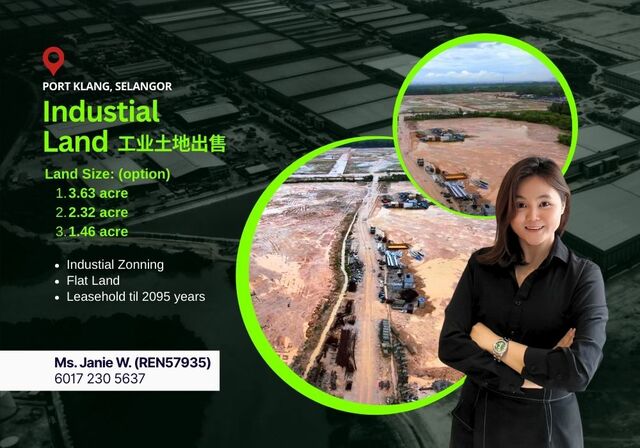
North Port
North Port, Port Klan, Selangor
$ 39 /month
Listed on March 2, 2026

Taman Equine
Jalan Equine
$ 520,800 /month
Listed on June 25, 2026
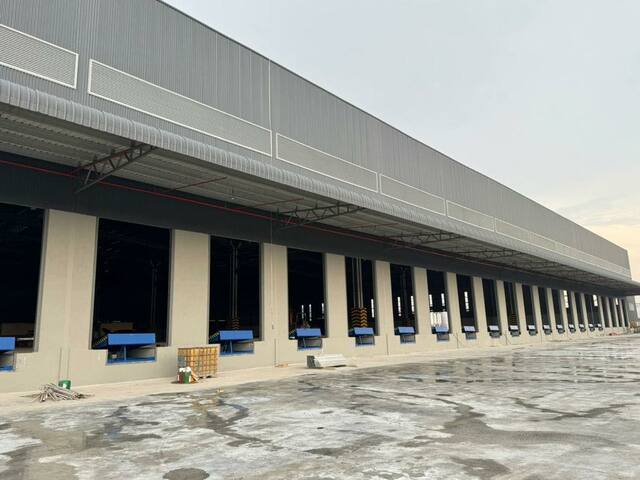
West Port, Pulau Indah
Pulau Indah West Port, Port Klang, Selangor
$ 116 /month
Listed on March 2, 2026
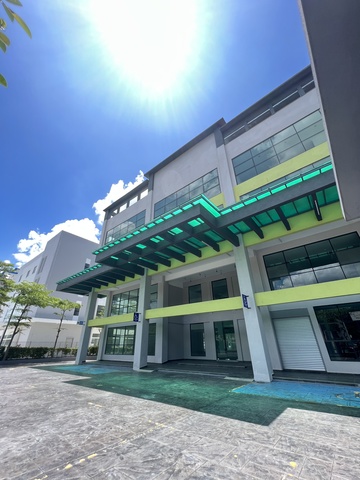
Seremban 2 , Commercial Building 5 Storey Warehouse Showroom Negeri Sembilan
seremban 2, Seremban 2, Negeri Sembilan
$ 4,550,000
Listed on July 30, 2023
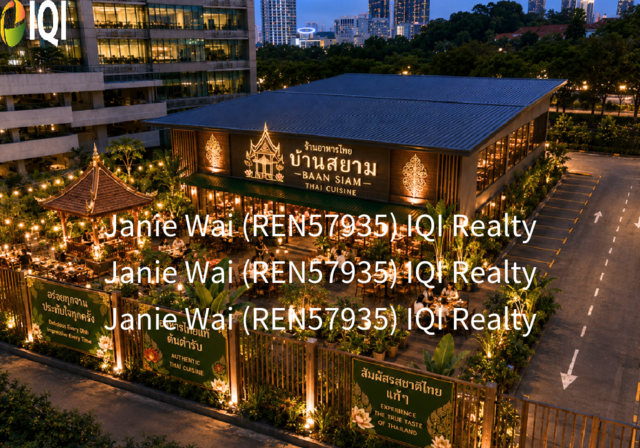
Mutiara Damansara
Mutiara Damansara
$ 63,000
Listed on May 12, 2026

Jalan Bukit Bintang
Jalan Bukit Bintang
$ 2,100 /month
Listed on March 19, 2025

Jalan Bukit Bintang
Jalan Bukit Bintang
$ 4,247 /month
Listed on March 19, 2025

Jalan Bukit Bintang
Jalan Bukit Bintang
$ 2,275 /month
Listed on March 19, 2025

Taman Perindustrian Bukit Serdang
Taman Perindustrian Bukit Serdang, Seri Kembangan, Selangor
$ 735,000
Listed on March 2, 2026

Jalan Bukit Kemuning
Kawasan Perindustrain, Seksyen 34, Shah Alam
$ 1,855,000
Listed on March 2, 2026
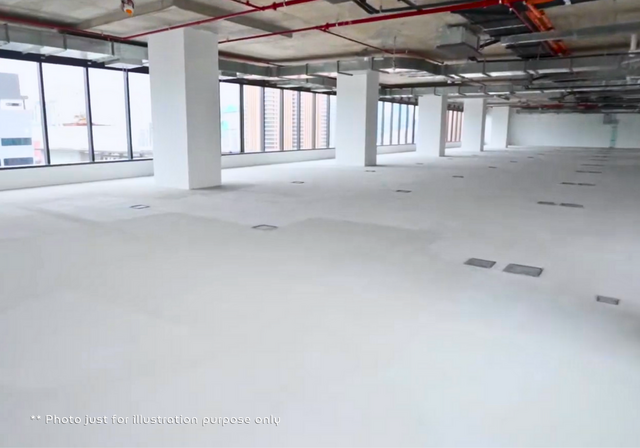
Jalan Bukit Bintang
Jalan Bukit Bintang
$ 11,682 /month
Listed on March 19, 2025

Port Klang Free Zone Warehouse Bonded Warehouse Malaysia Selangor 马来西亚保税仓库 雪兰莪仓库
Port Klang, 42920 Pulau Indah, Selangor
$ 47,600 /month
Listed on April 4, 2024

Port Klang Free Zone Warehouse Bonded Warehouse Malaysia Selangor 马来西亚保税仓库 雪兰莪仓库
Port Klang, 42920 Pulau Indah, Selangor
$ 59,735 /month
Listed on April 4, 2024
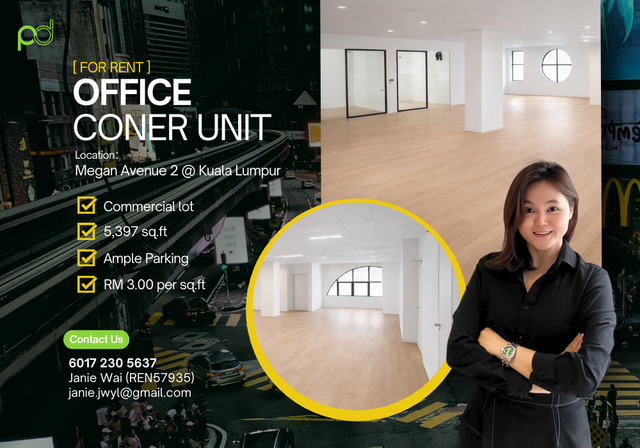
Megan Avenue 2
Jalan Yap Kwan Seng
$ 6,825 /month
Listed on August 5, 2025

Jalan Bukit Bintang
Jalan Bukit Bintang
$ 8,616 /month
Listed on March 19, 2025
Mortgage Calculator
Calculate your estimated month repayment and plan your monthly expenses well.
The mortgage calculator is intended for reference only. Actual amount may vary.
Monthly Payment
Send me the mortgage calculator result

Home Loan Eligibility Calculator
Calculate your potential loan amount and assess your home buying affordability.

Rental Yield
Calculate the potential rental yield and evaluate a property's investment performance.

Down Payment Saving Plan
Create a structured savings plan and determine how much to save monthly for your down payment plan.

Malaysian Property Transaction Fees Calculator
Estimate the total transaction fees and budget accurately for your Malaysian property purchase.
IQI blog & news
Articles specifically curated for your daily digest of local and global real estate news.

Australia Housing Market Slows in May 2026 Australia’s housing market showed clearer signs of slowing in May, with Cotality’s national Home Value Index remaining flat. The data suggests that momentum is easing across most regions as buyers face affordability pressure, tighter borrowing capacity and broader demand-side challenges. The slowdown was most visible in Sydney and Melbourne, where dwelling values fell by 0.9% and 0.8% respectively over the month. Both cities are now below their recent market peaks recorded in November last year. The ACT also softened slightly, with values down 0.2%. However, the market remains highly uneven. Perth and Darwin recorded the strongest monthly gains at 1.5%, followed by Brisbane and Hobart at 0.9%, and Adelaide at 0.5%. Cotality Research Director Tim Lawless noted that Australia’s housing market is moving at different speeds. Over the past five years, Perth home values surged 91.4%, while Melbourne rose only 3.3%, highlighting the gap between stronger and weaker city markets. Sales activity is also cooling. National home sales over the past three months were estimated to be 2.2% lower year-on-year and 4.1% below the five-year average. Sydney and Melbourne recorded the sharpest annual falls in sales, down 17.0% and 14.2% respectively. Outlook Looking ahead, Australia’s property market is expected to remain selective rather than broadly weak. Cities with stronger population growth, tighter supply and better affordability may continue to outperform. For buyers, rising listings and softer auction clearance rates could create more room to negotiate. For sellers, realistic pricing will be increasingly important as market conditions become more balanced. Juwai IQI Newsletter July 2026 RDownload
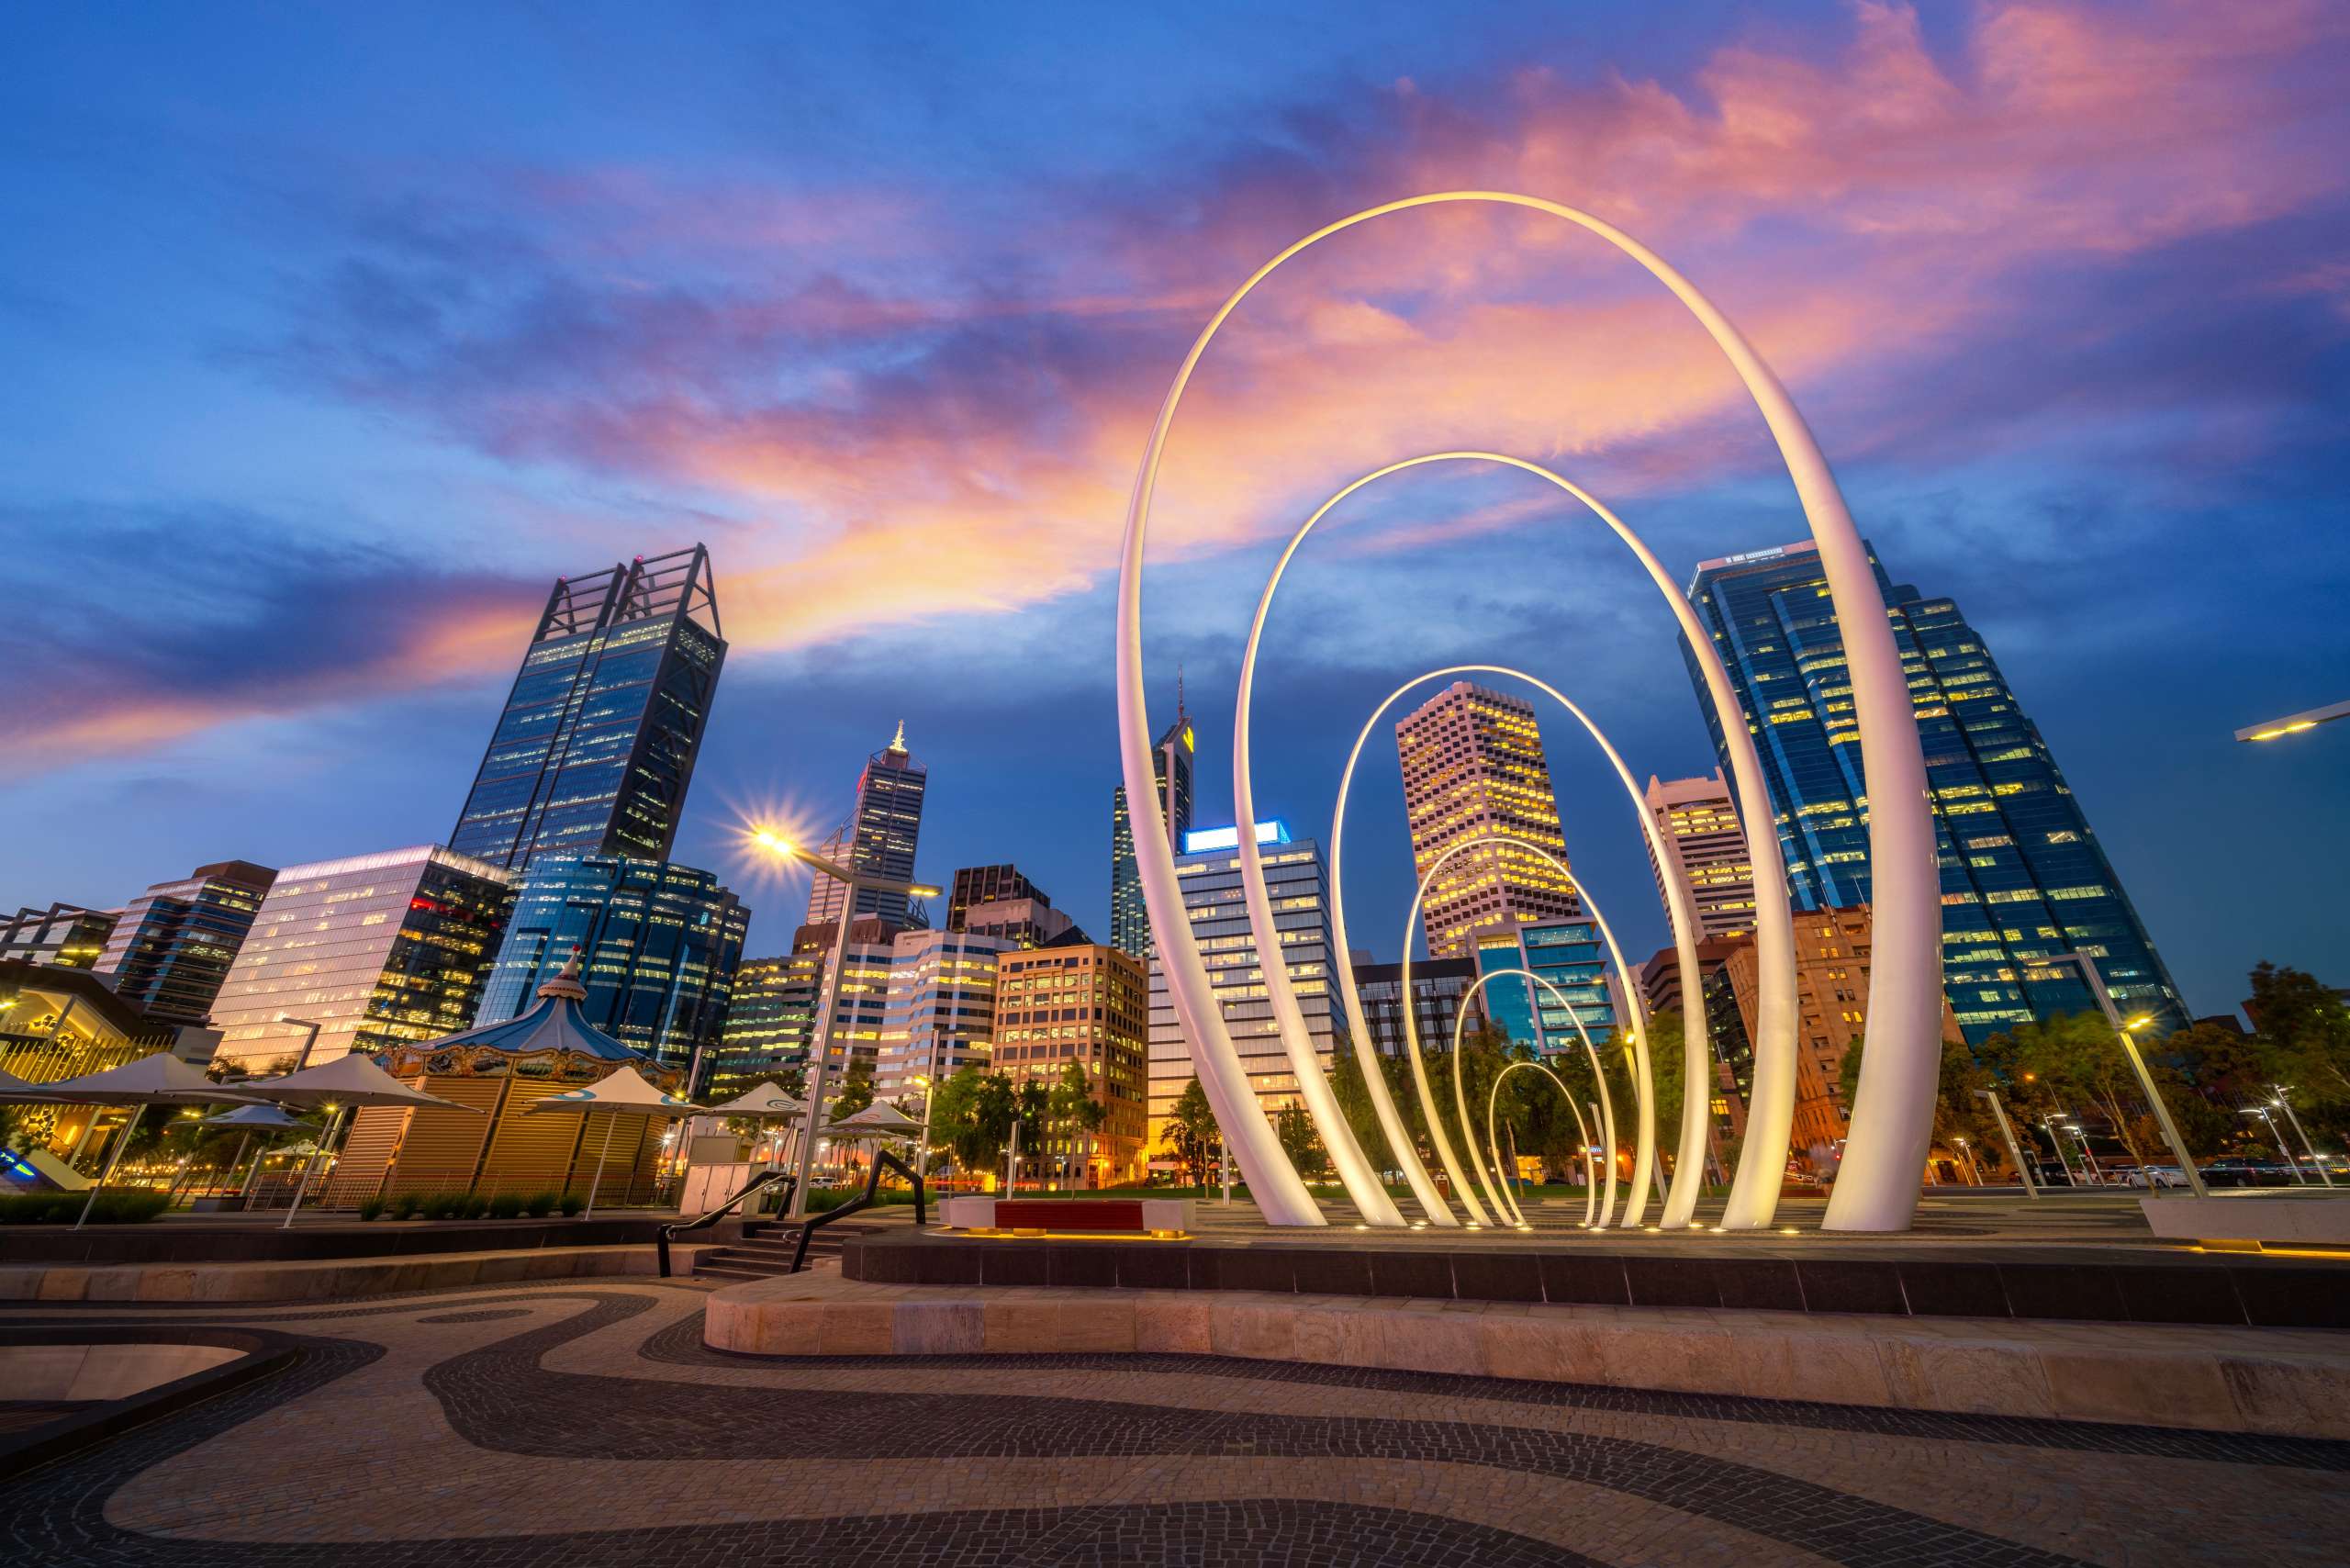
Australia’s housing market has entered 2026 with a clear split in performance across cities. While Sydney and Melbourne have begun to stabilise, mid-sized capitals continue to record solid growth, with several markets achieving more than 1% month-on-month increases. Perth Perth is leading the nation, with home values rising 2.3% in February alone, adding significant value to the median dwelling in just one month. Brisbane, Adelaide and Hobart also posted strong gains, reinforcing the growing strength of these markets as demand shifts beyond the traditional major cities. Sydney and Melbourne In contrast, Sydney and Melbourne were more sensitive to February’s rate hike and softer buyer sentiment. Property values in both cities remained flat over the month and showed slight declines over the rolling quarter, reflecting a more cautious market environment. A key factor supporting growth in the smaller capitals is limited housing supply. Perth listings remain significantly below historical averages, while Brisbane and Adelaide are also experiencing notable undersupply. Although stock levels in Sydney and Melbourne are still relatively tight, both cities have seen an increase in new listings, which may signal rising vendor activity amid softer conditions. At the same time, the more affordable end of the market continues to show resilience nationwide. In Sydney, lower-priced homes recorded modest growth, while higher-end properties declined. Ongoing demand from first-home buyers and investors, combined with tighter borrowing capacity at higher price points, continues to support entry-level segments. Overall, Australia’s property market is becoming more selective in 2026. For investors and homeowners, markets like Perth are presenting compelling opportunities, driven by strong growth, affordability, and supply constraints. As Australia’s property market shifts, opportunities are becoming more location-driven than ever. Whether you are exploring high-growth markets like Perth or reassessing your strategy in major cities, now is the time to make informed decisions. Connect with our team at sales@iqiwa.com.au to discover where the real opportunities are and take your next step with confidence. Download to see insights form other country marketsDownload
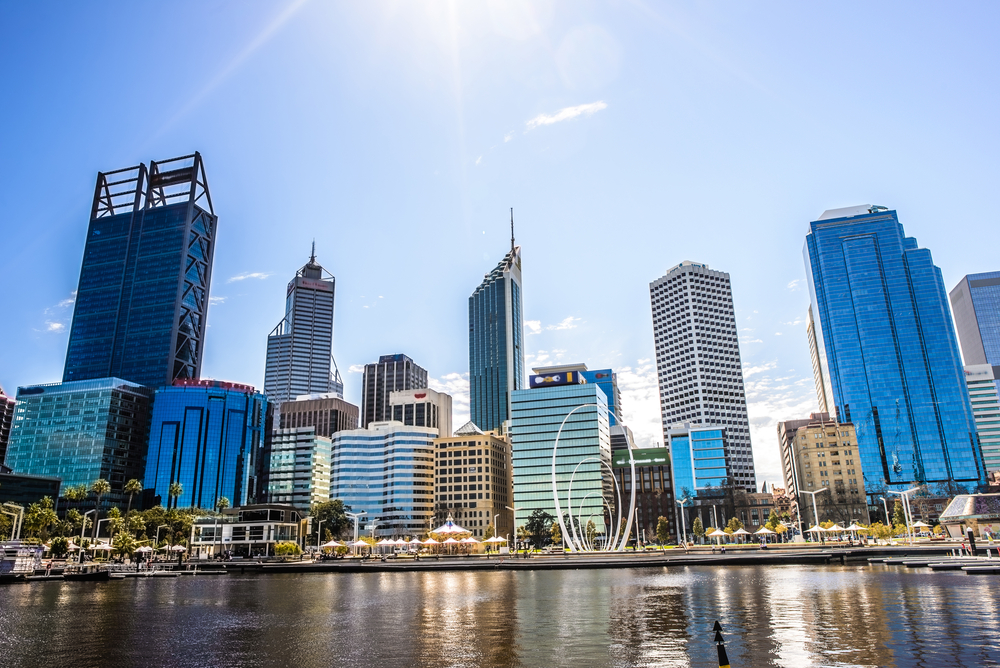
Australian home values continued their upward trend in January, rising 0.8% nationwide, according to Cotality’s Home Value Index. This marks a modest acceleration from December’s 0.6% increase and highlights the market’s resilience despite affordability pressures. All capital cities and regional markets recorded price growth during the month. However, results were mixed acrosst the major capitals. Sydney (+0.2%) and Melbourne (+0.1%) posted only modest gains, following slight declines in December. Both cities remain just below their peak values, with Sydney sitting 0.1% below its November 2025 high and Melbourne 0.7% below its March 2022 peak. Mid-sized capitals continue to lead the market, though momentum is easing. Perth recorded the strongest growth at 2.0%, followed by Brisbane (+1.6%) and Adelaide (+1.2%), all slightly slower than their late-2025 peaks. Cotality’s Research Director, Tim Lawless, noted that price growth remains supported by severely limited housing supply, with listings 19% lower than a year ago and 25% below the five-year average, while buyer demand remains above average. However, he expects market momentum to soften through 2026 as affordability constraints, cost-of-living pressures, potential interest rate increases and slower population growth begin to weigh on demand. At the same time, growth is being driven largely by lower-priced homes, particularly houses. Across the combined capitals, lower-quartile house values rose 1.3% in January, compared with just 0.3% growth in the upper quartile, reflecting intense competition among first home buyers, investors and value-focused buyers. Overall, the market remains resilient, but signs are emerging that the pace of growth may gradually moderate as economic pressures build. For investors and homeowners alike, Perth’s property market presents exciting opportunities. Whether you’re considering selling, buying, or investing, now is the time to explore your options. Contact our team at sales@iqiwa.com.au to discuss your property goals today. Download to see insights from other country marketsDownload

Australia’s housing market delivered solid gains in 2025, with national home values rising 8.6%, adding around $71,400 to the median dwelling price, the strongest annual growth since 2021. All capital cities and regional markets recorded increases, led by Darwin (+18.9%), while Melbourne saw the smallest rise at 4.8%.However, momentum began to cool in December, when the national Home Value Index recorded its smallestmonthly gain in five months (+0.7%). Sydney and Melbourne both declined by -0.1%, marking the first monthly fall in over a year. Cotality’s research director Tim Lawless attributes this softening to renewed concerns that interest rates may remain “higher for longer”, along with worsening affordability and cost-of-living pressures. Growth has increasingly been driven by the lower and middle segments of the market, as affordability pressures continue to steer buyers away from higher-priced homes. Upper-quartile values rose just 0.2% in December, compared with 1.1% growth in the more affordable segments. Regional markets remain more resilient, posting 9.7% growth for the year, outperforming the combine capitals at 8.2%. Western Australia’s regions (+16.1%) and regional Queensland (+12.6%) were the standout performers. Outlook for 2026 While 2025 closed strongly, the outlook for 2026 is more cautious. Uncertainty around inflation, interest rates, affordability and household debt is expected to weigh on confidence. That said, ongoing housing supply shortages should help prevent any significant downturn in home values. For investors and homeowners alike, Perth’s property market presents exciting opportunities. Whether you’reconsidering selling, buying, or investing, now is the time to explore your options. Contact our team atsales@iqiwa.com.au to discuss your property goals today. Download to see insights from other country marketsDownload
Ready to get started?
Get in touch now.