Negotiator ∙ Elite

Michelle T.

REN76257
Michelle T. profile picture

About Michelle T.

Residential Property Negotiator specializing in rentals and sales in Petaling Jaya, Sunway, and Subang Jaya. I help tenants, homebuyers, homeowners, and property investors with condominiums, apartments, and landed homes, providing reliable market advice and professional guidance throughout the prope... Residential Property Negotiator specializing in rentals and sales in Petaling Jaya, Sunway, and Subang Jaya. I help tenants, homebuyers, homeowners, and property investors with condominiums, apartments, and landed homes, providing reliable market advice and professional guidance throughout the property journey. Committed to responsive service, transparent communication, and smooth property transactions from inquiry to completion.

1 year at IQI

18 properties on sale

12 properties on rent

Michelle T.'s Service Locations

Up to 100 properties with precise addresses are displayed on the map.
Select a filter to see listings
Showing all listings

My Listings

The Residence, Mont Kiara photo

The Residence, Mont Kiara

Jalan Changkat Suria 1

8
8
690
8000 ft²
8573 ft²

$ 3,363,950

Listed on May 19, 2026

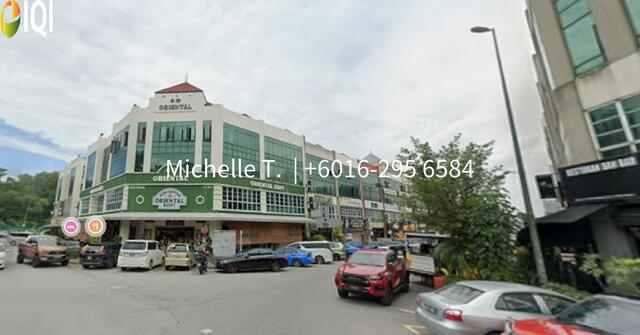
Menara Pacific (Pillar 8) @ KL Eco City photo

Menara Pacific (Pillar 8) @ KL Eco City

Menara Pacific

886
4467 ft²

$ 12,394 /month

Listed on May 29, 2026

Regent Suites photo

Regent Suites

3, Jalan Damanlela, Bukit Damansara, 50490 Kuala Lumpur

1+1
2
913
816 ft²

$ 3,116 /month

Listed on May 29, 2026

SS3 Kelana Jaya photo

SS3 Kelana Jaya

SS3

7
4
525
2500 ft²
5892 ft²

$ 1,062,300

Listed on June 8, 2026

Villa Damansara photo

Villa Damansara

PJU 5, Seksyen 4

6
7
637
7311 ft²
7933 ft²

$ 1,345,580

Listed on May 30, 2026

Taman Desa photo

Taman Desa

Taman Desa

6
5
589
5914 ft²
7071 ft²

$ 1,345,580

Listed on June 8, 2026

USJ 17 photo

USJ 17

USJ 17

8
6
491
11000 ft²

$ 1,345,580

Listed on June 8, 2026

Bandar Puteri Puchong photo

Bandar Puteri Puchong

Bandar Puteri Puchong

725
3840 ft²

$ 3,860 /month

Listed on May 29, 2026

Kelana Idaman, Ara Damansara photo

Kelana Idaman, Ara Damansara

Kelana Idaman, Kelana Jaya, 47301 Petaling Jaya

3+1
3
647
1600 ft²
1950 ft²

$ 336,395

Listed on May 20, 2026

Kelana Jaya photo

Kelana Jaya

SS 6, 47301 Petaling Jaya, Selangor

867
20000 ft²
65340 ft²

$ 14,412 /month

Listed on May 30, 2026

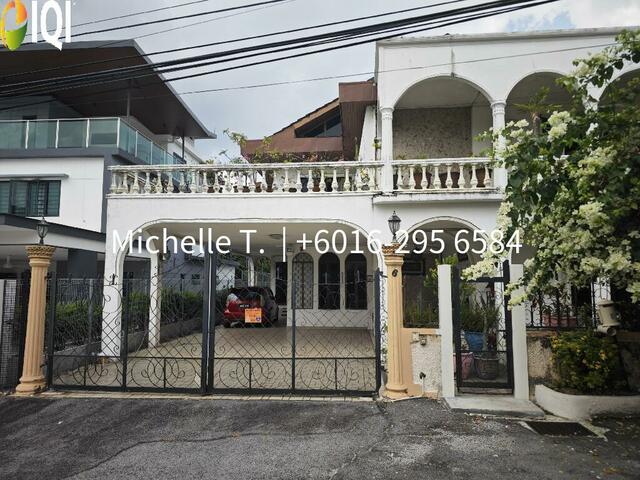
Taman Tun Dr Ismail photo

Taman Tun Dr Ismail

Lorong Burhanuddin Helmi

9
7
637
6729 ft²
5403 ft²

$ 1,823,615

Listed on May 19, 2026

Taman Bukit Kinrara photo

Taman Bukit Kinrara

Jalan Taman Bukit Kinrara 1/1, Bandar Kinrara

6
6
637
3400 ft²
4759 ft²

$ 991,480

Listed on June 8, 2026

TTDI Hills photo

TTDI Hills

Jalan Changkat Datuk Sulaiman

6
6
626
7500 ft²
10355 ft²

$ 2,407,880

Listed on May 19, 2026

SS4, Kelana Jaya photo

SS4, Kelana Jaya

SS4

7
6
584
4850 ft²
6800 ft²

$ 1,133,120

Listed on June 8, 2026

SS 19 photo

SS 19

SS 19

6
4
536
4000 ft²
9332 ft²

$ 1,203,940

Listed on June 8, 2026

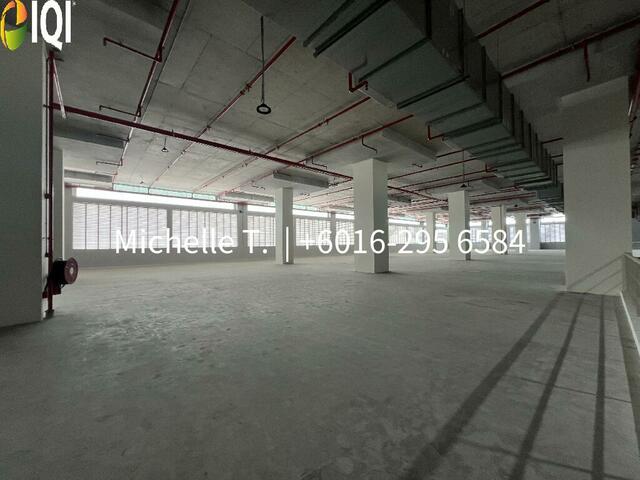
Kawasan Industri Kota Kemuning photo

Kawasan Industri Kota Kemuning

Seksyen 33 Kota Kemuning

884
105658 ft²
999998 ft²

$ 78,568 /month

Listed on May 29, 2026

Foresthill Damansara photo

Foresthill Damansara

Damansara Perdana

5+1
6
548
5325 ft²
3444 ft²

$ 1,097,710

Listed on June 8, 2026

Seksyen 9, Kota Damansara photo

Seksyen 9, Kota Damansara

Rimba Valley

7+1
9
684
8000 ft²
15500 ft²

$ 1,763,418

Listed on May 21, 2026

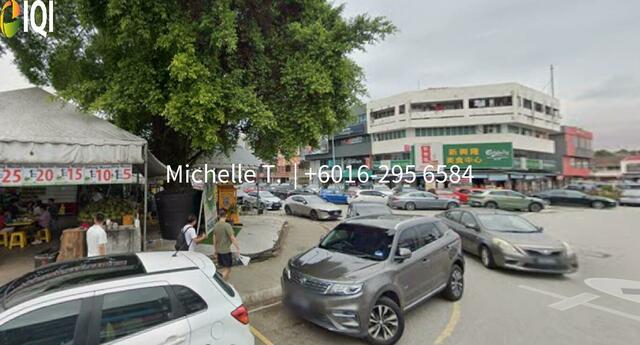
Kuchai Entrepreneurs Park photo

Kuchai Entrepreneurs Park

Jalan Kuchai

825
3508 ft²
3900 ft²

$ 3,506 /month

Listed on May 29, 2026

USJ 3 photo

USJ 3

USJ 3

5
5
538
3800 ft²
5227 ft²

$ 1,062,300

Listed on June 8, 2026

Menara PKNS photo

Menara PKNS

Jalan Yong Shook Lin, Seksyen 7

793
8214 ft²

$ 11,331 /month

Listed on May 30, 2026

SS 2 PETALING JAYA photo

SS 2 PETALING JAYA

SS 2 PETALING JAYA

720
5 ft²

$ 12,748 /month

Listed on May 29, 2026

SS7 Kelana Jaya photo

SS7 Kelana Jaya

SS7

7+1
6
588
6708 ft²
10495 ft²

$ 1,026,890

Listed on June 8, 2026

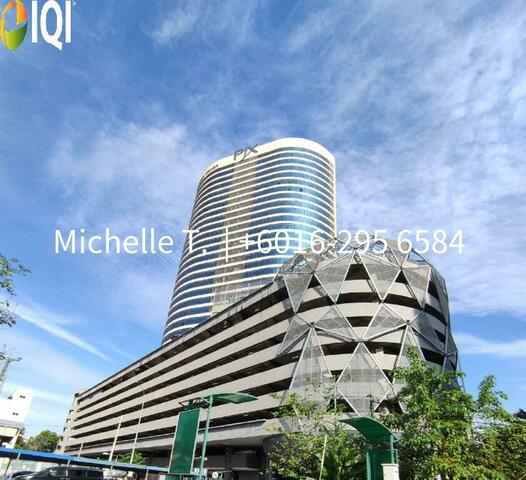
PJX HM Shah Tower photo

PJX HM Shah Tower

Jalan Persiaran Barat, Pjs 52, 46200 Petaling Jaya, Selangor

778
3376 ft²

$ 4,532 /month

Listed on May 30, 2026

Siera Park photo

Siera Park

27, Jalan PJU 1a/5a, Ara Damansara, Petaling Jaya

608
4844 ft²
1725 ft²

$ 1,133,120

Listed on June 8, 2026

Menara Axis photo

Menara Axis

Jalan 51A/223, 46100 Petaling Jaya

773
5200 ft²

$ 6,374 /month

Listed on May 29, 2026

Kinrara Industrial Park photo

Kinrara Industrial Park

Section 1, Bandar Kinrara, 47180, Puchong

755
51243 ft²

$ 81,653 /month

Listed on May 30, 2026

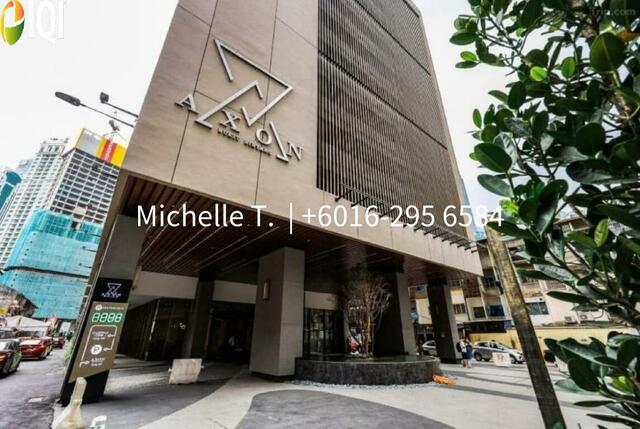
Axon Bukit Bintang photo

Axon Bukit Bintang

Axon Bukit Bintang

1
1
644
450 ft²

$ 311,608

Listed on June 2, 2026

Le Yuan Residence photo

Le Yuan Residence

Off Jalan Senang Ria, Happy Garden

4
4
628
1710 ft²

$ 300,985

Listed on May 30, 2026

Laurel Residences photo

Laurel Residences

Jalan Kerinchi Kanan, Bangsar South, 59200 Kuala Lumpur, Wilayah Persekutuan Kuala Lumpur

2
1
889
590 ft²

$ 1,115 /month

Listed on May 19, 2026

Our newly launched projects

Discover the real estate properties in and around Kuala Lumpur, Malaysia. Buy apartment units, landed houses, bungalows, commercial office space, shop lots, and sub-sales with 100% confidence at IQI Global.

Mortgage Calculator

Calculate your estimated month repayment and plan your monthly expenses well.

Loan Amount

Interest Rate (%)

%

Loan Tenure (Years)

years

The mortgage calculator is intended for reference only. Actual amount may vary.

Monthly Payment

Loan amount

Principal

Interest

Estimated Monthly Repayment

Send me the mortgage calculator result

IQI blog & news

Articles specifically curated for your daily digest of local and global real estate news.

Australia Property Market July 2026: Housing Momentum Slows as Buyers Gain More Choice

Australia Housing Market Slows in May 2026 Australia’s housing market showed clearer signs of slowing in May, with Cotality’s national Home Value Index remaining flat. The data suggests that momentum is easing across most regions as buyers face affordability pressure, tighter borrowing capacity and broader demand-side challenges. The slowdown was most visible in Sydney and Melbourne, where dwelling values fell by 0.9% and 0.8% respectively over the month. Both cities are now below their recent market peaks recorded in November last year. The ACT also softened slightly, with values down 0.2%. However, the market remains highly uneven. Perth and Darwin recorded the strongest monthly gains at 1.5%, followed by Brisbane and Hobart at 0.9%, and Adelaide at 0.5%. Cotality Research Director Tim Lawless noted that Australia’s housing market is moving at different speeds. Over the past five years, Perth home values surged 91.4%, while Melbourne rose only 3.3%, highlighting the gap between stronger and weaker city markets. Sales activity is also cooling. National home sales over the past three months were estimated to be 2.2% lower year-on-year and 4.1% below the five-year average. Sydney and Melbourne recorded the sharpest annual falls in sales, down 17.0% and 14.2% respectively. Outlook Looking ahead, Australia’s property market is expected to remain selective rather than broadly weak. Cities with stronger population growth, tighter supply and better affordability may continue to outperform. For buyers, rising listings and softer auction clearance rates could create more room to negotiate. For sellers, realistic pricing will be increasingly important as market conditions become more balanced. Juwai IQI Newsletter July 2026 RDownload

Read more
Australia Property Market Split: Perth Surges, Sydney and Melbourne Stall

Australia’s housing market has entered 2026 with a clear split in performance across cities. While Sydney and Melbourne have begun to stabilise, mid-sized capitals continue to record solid growth, with several markets achieving more than 1% month-on-month increases. Perth Perth is leading the nation, with home values rising 2.3% in February alone, adding significant value to the median dwelling in just one month. Brisbane, Adelaide and Hobart also posted strong gains, reinforcing the growing strength of these markets as demand shifts beyond the traditional major cities. Sydney and Melbourne In contrast, Sydney and Melbourne were more sensitive to February’s rate hike and softer buyer sentiment. Property values in both cities remained flat over the month and showed slight declines over the rolling quarter, reflecting a more cautious market environment. A key factor supporting growth in the smaller capitals is limited housing supply. Perth listings remain significantly below historical averages, while Brisbane and Adelaide are also experiencing notable undersupply. Although stock levels in Sydney and Melbourne are still relatively tight, both cities have seen an increase in new listings, which may signal rising vendor activity amid softer conditions. At the same time, the more affordable end of the market continues to show resilience nationwide. In Sydney, lower-priced homes recorded modest growth, while higher-end properties declined. Ongoing demand from first-home buyers and investors, combined with tighter borrowing capacity at higher price points, continues to support entry-level segments. Overall, Australia’s property market is becoming more selective in 2026. For investors and homeowners, markets like Perth are presenting compelling opportunities, driven by strong growth, affordability, and supply constraints. As Australia’s property market shifts, opportunities are becoming more location-driven than ever. Whether you are exploring high-growth markets like Perth or reassessing your strategy in major cities, now is the time to make informed decisions. Connect with our team at sales@iqiwa.com.au to discover where the real opportunities are and take your next step with confidence. Download to see insights form other country marketsDownload

Read more
Australia’s Home Values Climb 0.8% in January as Supply Shortages Support Growth

Australian home values continued their upward trend in January, rising 0.8% nationwide, according to Cotality’s Home Value Index. This marks a modest acceleration from December’s 0.6% increase and highlights the market’s resilience despite affordability pressures. All capital cities and regional markets recorded price growth during the month. However, results were mixed acrosst the major capitals. Sydney (+0.2%) and Melbourne (+0.1%) posted only modest gains, following slight declines in December. Both cities remain just below their peak values, with Sydney sitting 0.1% below its November 2025 high and Melbourne 0.7% below its March 2022 peak. Mid-sized capitals continue to lead the market, though momentum is easing. Perth recorded the strongest growth at 2.0%, followed by Brisbane (+1.6%) and Adelaide (+1.2%), all slightly slower than their late-2025 peaks. Cotality’s Research Director, Tim Lawless, noted that price growth remains supported by severely limited housing supply, with listings 19% lower than a year ago and 25% below the five-year average, while buyer demand remains above average. However, he expects market momentum to soften through 2026 as affordability constraints, cost-of-living pressures, potential interest rate increases and slower population growth begin to weigh on demand. At the same time, growth is being driven largely by lower-priced homes, particularly houses. Across the combined capitals, lower-quartile house values rose 1.3% in January, compared with just 0.3% growth in the upper quartile, reflecting intense competition among first home buyers, investors and value-focused buyers. Overall, the market remains resilient, but signs are emerging that the pace of growth may gradually moderate as economic pressures build. For investors and homeowners alike, Perth’s property market presents exciting opportunities. Whether you’re considering selling, buying, or investing, now is the time to explore your options. Contact our team at sales@iqiwa.com.au to discuss your property goals today. Download to see insights from other country marketsDownload

Read more
Housing Market Snapshot: Strong 2025, Softer Outlook for 2026

Australia’s housing market delivered solid gains in 2025, with national home values rising 8.6%, adding around $71,400 to the median dwelling price, the strongest annual growth since 2021. All capital cities and regional markets recorded increases, led by Darwin (+18.9%), while Melbourne saw the smallest rise at 4.8%.However, momentum began to cool in December, when the national Home Value Index recorded its smallestmonthly gain in five months (+0.7%). Sydney and Melbourne both declined by -0.1%, marking the first monthly fall in over a year. Cotality’s research director Tim Lawless attributes this softening to renewed concerns that interest rates may remain “higher for longer”, along with worsening affordability and cost-of-living pressures. Growth has increasingly been driven by the lower and middle segments of the market, as affordability pressures continue to steer buyers away from higher-priced homes. Upper-quartile values rose just 0.2% in December, compared with 1.1% growth in the more affordable segments. Regional markets remain more resilient, posting 9.7% growth for the year, outperforming the combine capitals at 8.2%. Western Australia’s regions (+16.1%) and regional Queensland (+12.6%) were the standout performers. Outlook for 2026 While 2025 closed strongly, the outlook for 2026 is more cautious. Uncertainty around inflation, interest rates, affordability and household debt is expected to weigh on confidence. That said, ongoing housing supply shortages should help prevent any significant downturn in home values. For investors and homeowners alike, Perth’s property market presents exciting opportunities. Whether you’reconsidering selling, buying, or investing, now is the time to explore your options. Contact our team atsales@iqiwa.com.au to discuss your property goals today. Download to see insights from other country marketsDownload

Read more

Ready to get started?

Get in touch now.