

Team Leader (Subsales) ∙ United
Connie Wong
REN64977
Team Leader (Subsales) ∙ United
Connie Wong
REN64977
About Connie Wong
Leveraging market knowledge and negotiation skills to deliver exceptional results. Your real estate success is my priority. Ready to make your real estate dreams a reality? Let's chat. Your dream home awaits.
3 years at IQI
125 transactions
31 properties on sale
31 properties on rent
Contact Connie Wong
Connie Wong Social Links
No social links available.
Connie Wong's Service Locations
Connie Wong's Service Locations
My Listings
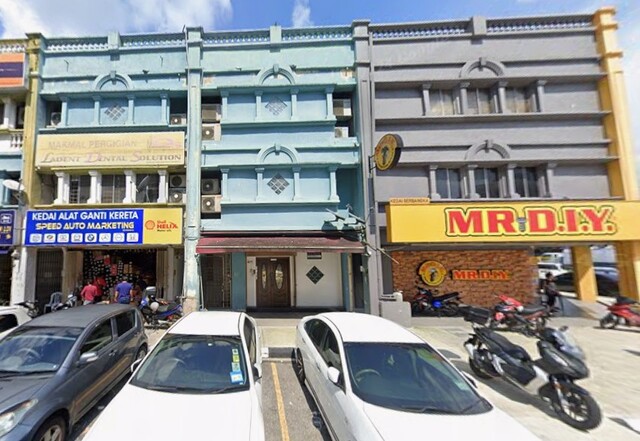
Taman Sri Rampai
Setapak
$ 2,292 /month
Listed on August 23, 2026
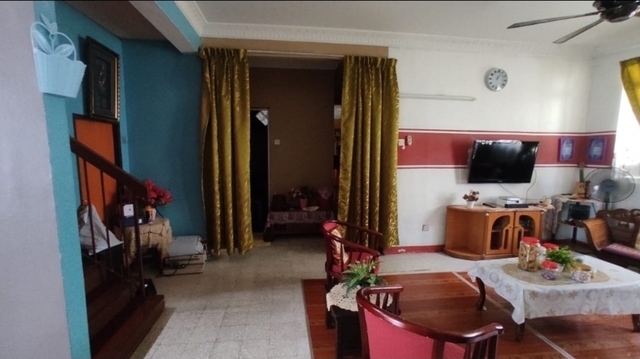
Taman Bukit Cheras
Taman Bukit Cheras 56000 Cheras
$ 705,200
Listed on June 25, 2026
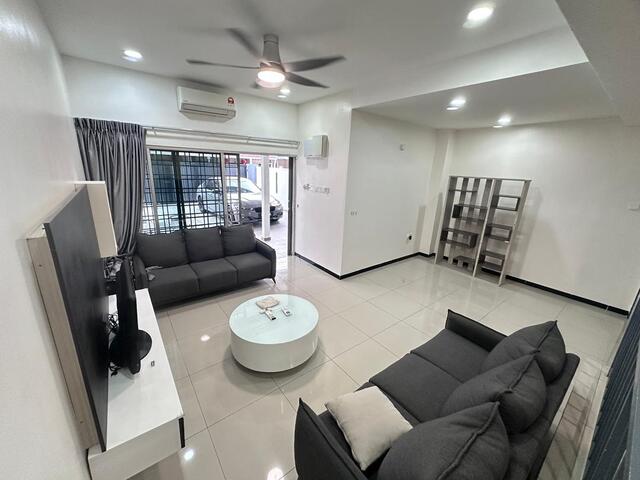
Taman Kajang Baru
Jalan 1
$ 211,207
Listed on September 2, 2026
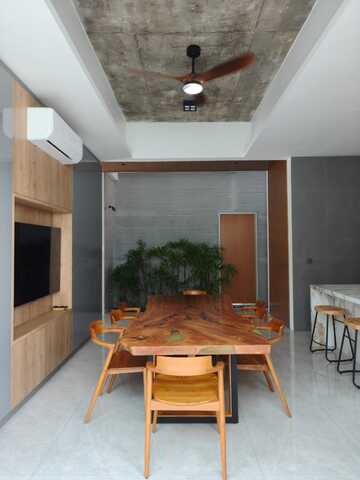
Bukit Suria Garden Village
Garden Village, Jalan 1, Bukit Suria, 43000 Kajang
$ 1,621,960
Listed on August 23, 2026
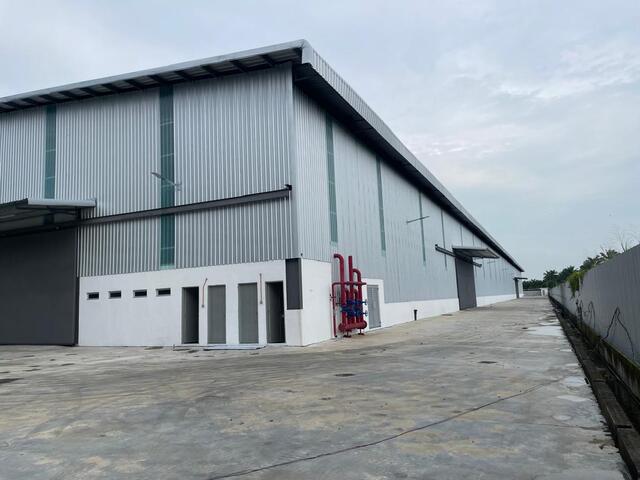
Kawasan Perusahaan Telok Mengkuang
Kawasan Perusahaan Telok Mengkuang 42500, Telok Panglima Garang
$ 75,597 /month
Listed on August 21, 2026
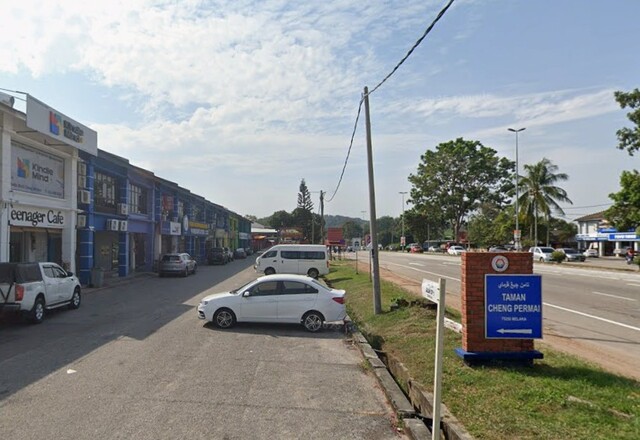
TAMAN CHENG PERMAI
JALAN CP 1, TAMAN CHENG PERMAI
$ 1,375 /month
Listed on August 29, 2026
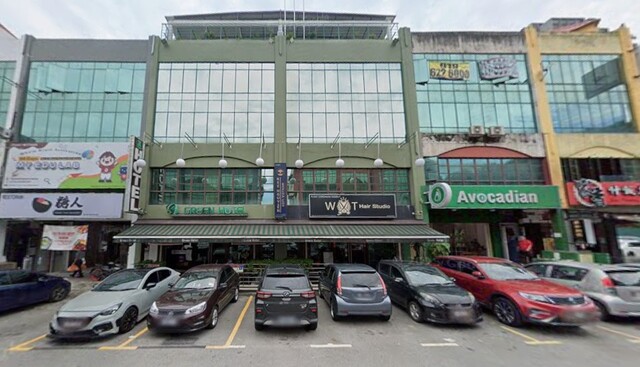
Bandar Puteri Puchong
Bandar Puteri, 47100 Puchong
$ 8,462 /month
Listed on October 5, 2026
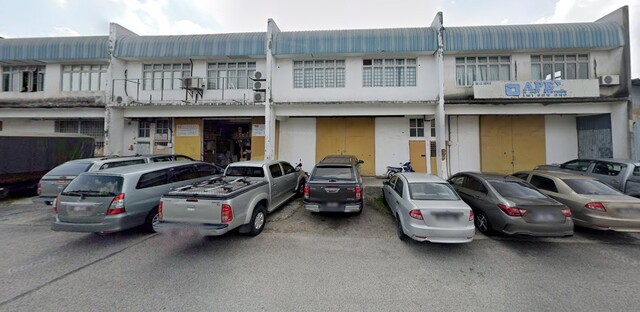
Taming Jaya Industrial Park
Balakong
$ 2,116 /month
Listed on September 21, 2026
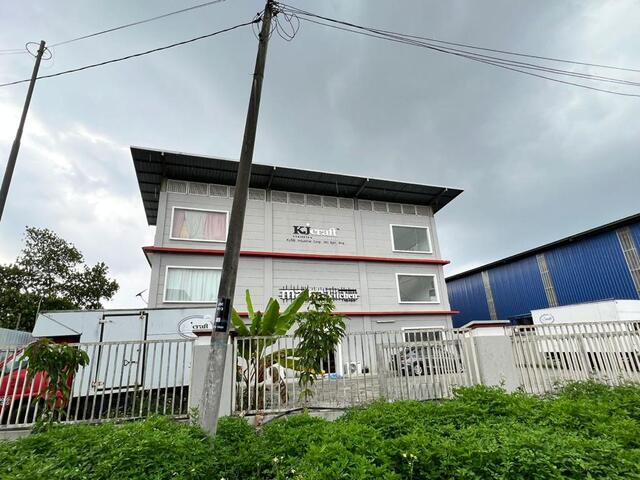
Seksyen U9
Seksyen U9 40150 Shah Alam
$ 8,462 /month
Listed on September 22, 2026
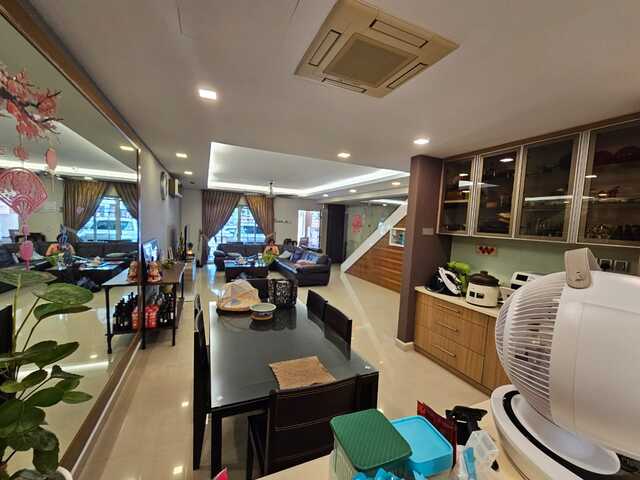
Taman Bukit Segar Jaya
Jalan Bukit Segar
$ 416,068
Listed on August 21, 2026
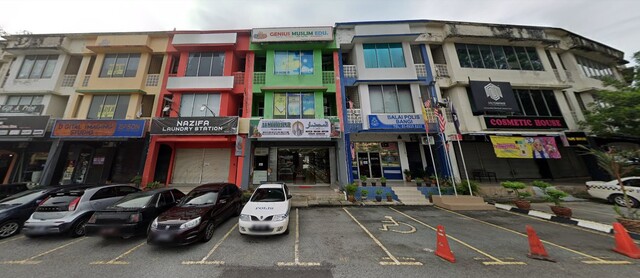
Bandar Seri Putra
Bandar Seri Putra, 43000, Kajang
$ 3,103 /month
Listed on September 21, 2026
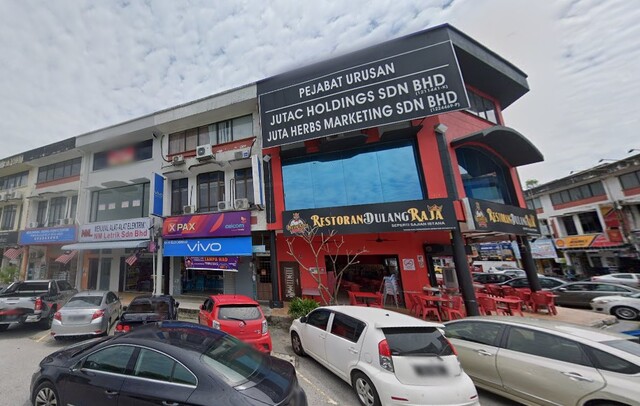
Taman TTDI Jaya
Taman TTDI Jaya, 40150 Shah Alam
$ 810,980
Listed on September 21, 2026
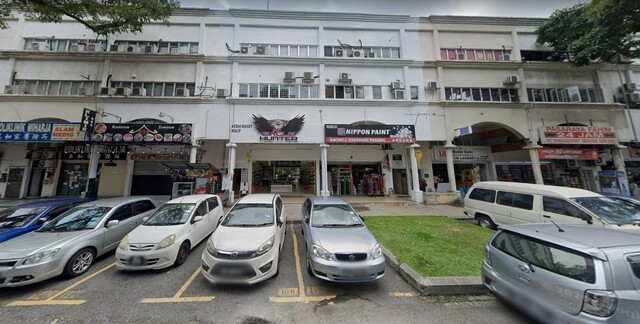
Taman Miharja
Jalan 2/93, Jalan 3/93, Jalan 4/93
$ 810,980
Listed on August 6, 2026
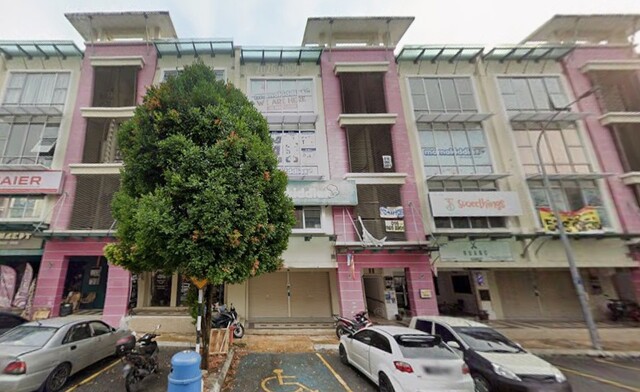
Setia Perdana
Jalan Setia Perdana
$ 1,516,180
Listed on October 1, 2026
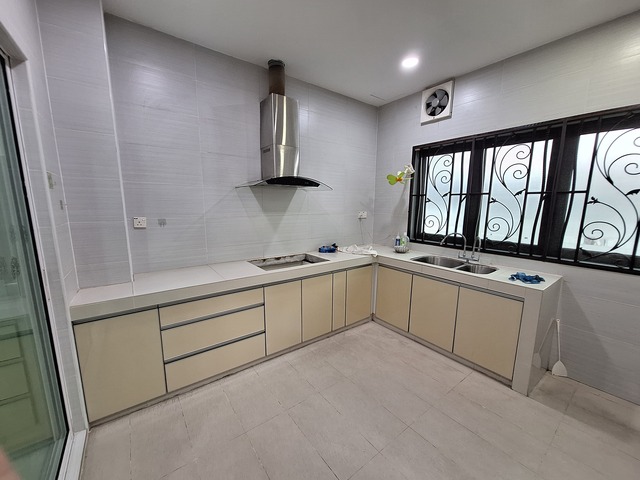
Taman Bukit Suria 2
Taman Bukit Suria 2, 43000 Kajang
$ 564,160
Listed on March 8, 2026
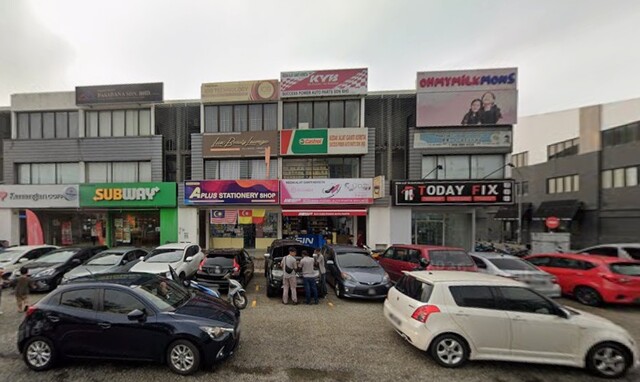
Setia Utama, Seksyen U13, Setia Alam
Seksyen U13 40170 Shah Alam
$ 2,997 /month
Listed on October 1, 2026
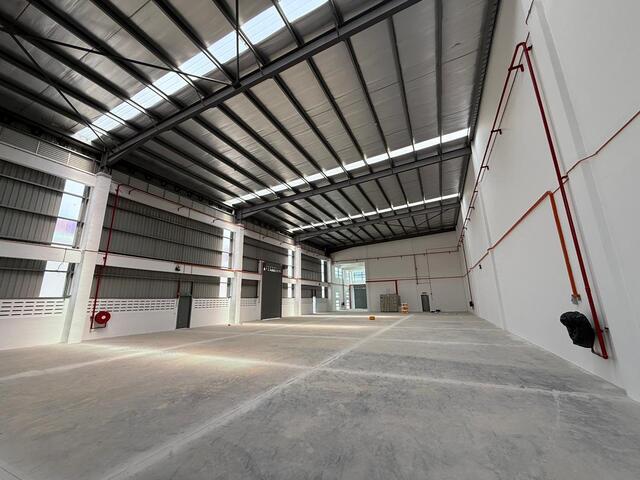
COMPASS @ Kota Seri Langat
Persiaran Kota Seri Langat
$ 8,744 /month
Listed on September 21, 2026
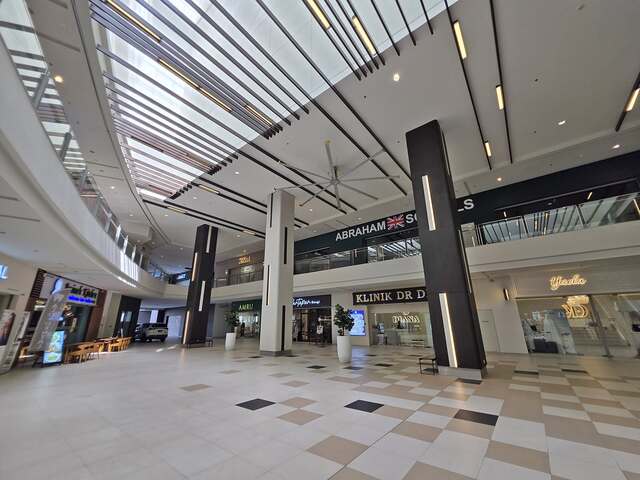
Sunway Gandaria
Jln Medan Pusat Bandar 7, Seksyen 9, 43650 Bandar Baru Bangi
$ 7,757 /month
Listed on September 3, 2026
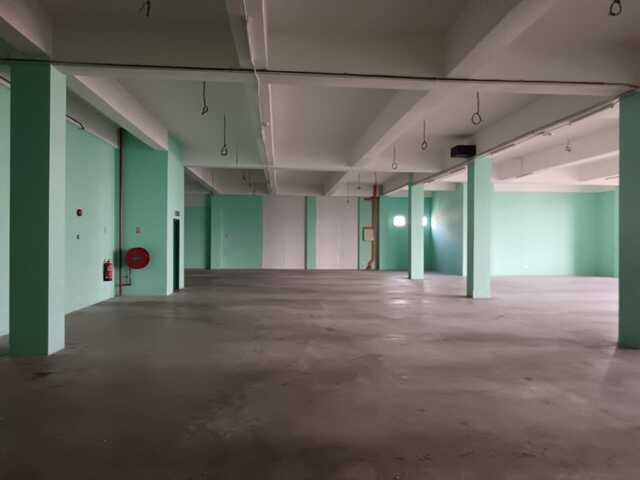
Taman Perindustrian Meranti Jaya
Taman Perindustrian Meranti Jaya 47120 Puchong
$ 9,872,800
Listed on September 16, 2026
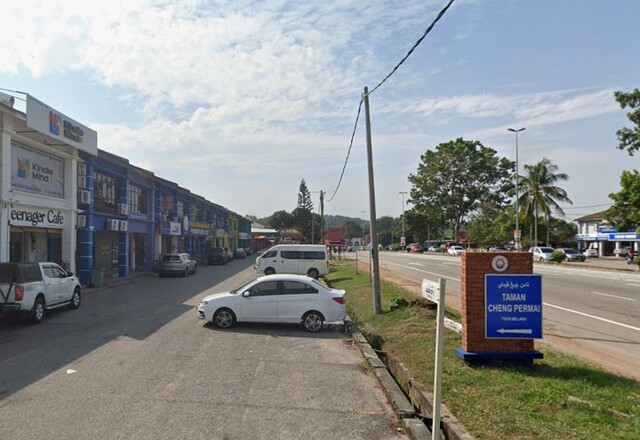
TAMAN CHENG PERMAI
JALAN CP 1, TAMAN CHENG PERMAI
$ 4,866 /month
Listed on August 29, 2026
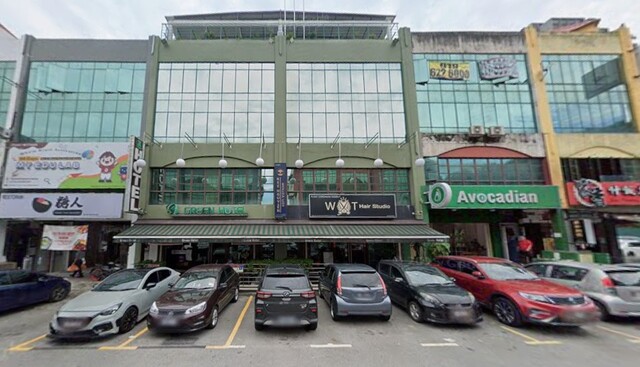
Bandar Puteri Puchong
Bandar Puteri, 47100 Puchong
$ 12,694 /month
Listed on October 5, 2026
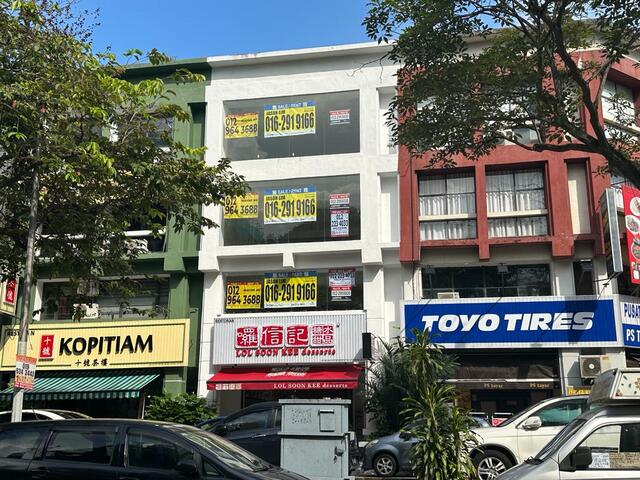
Taman Danau Desa
Taman Desa, 58100 KL
$ 1,939 /month
Listed on September 16, 2026
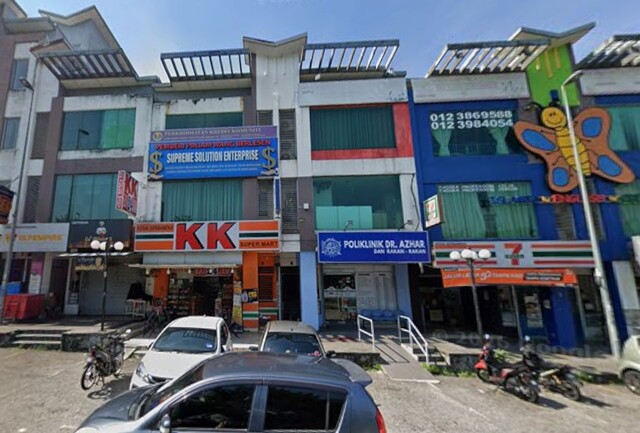
Bandar Mahkota Cheras
Bandar Mahkota Cheras 43200 Cheras
$ 2,468 /month
Listed on September 21, 2026
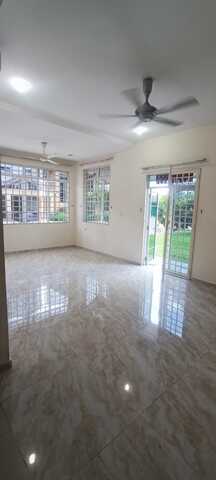
Tiara Villa
Jalan Sekutu, Taman Gembira
$ 1,093,060
Listed on August 24, 2026
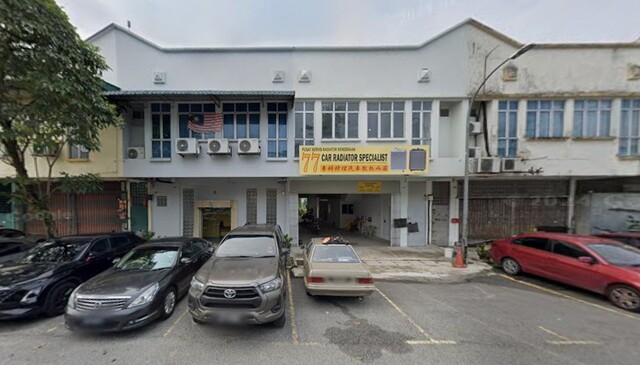
Kawasan Perindustrian Mas Jaya
Jalan Mas Jaya
$ 2,116 /month
Listed on October 1, 2026
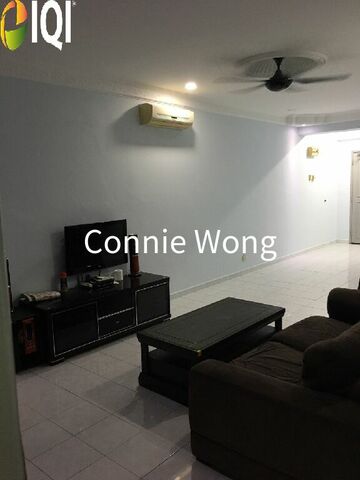
Forest Green
Jalan Sungai Long, Bandar Baru Sungai Long
$ 105,427
Listed on July 26, 2025
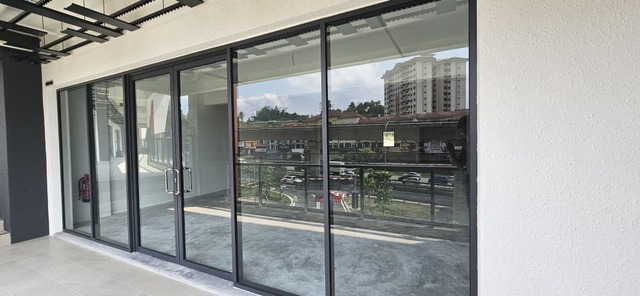
Skyloft Avenue, Bandar Puchong Jaya
Bandar Puchong Jaya 47100 Puchong
$ 2,468 /month
Listed on September 16, 2026
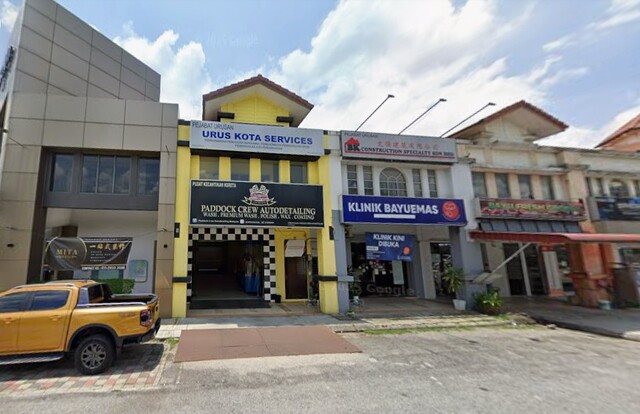
Kota Bayuemas
Pendamar, 41200 Klang
$ 698,148
Listed on September 21, 2026

Ridgeview Residences @ Kajang
Jalan Ridgeview
$ 758,090
Listed on August 6, 2026
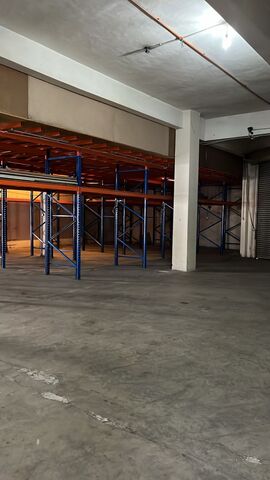
Balakong Jaya Industrial Park
Balakong, 43300, Seri Kembangan
$ 5,113 /month
Listed on September 21, 2026
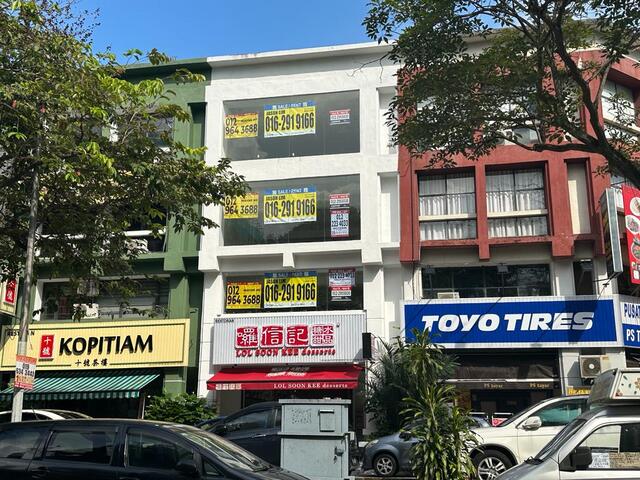
Taman Danau Desa
Taman Desa, 58100 KL
$ 6,523 /month
Listed on September 15, 2026

Pavilion Embassy Residence
Jalan Ampang, 55000, Kuala Lumpur
$ 1,657 /month
Listed on March 19, 2025
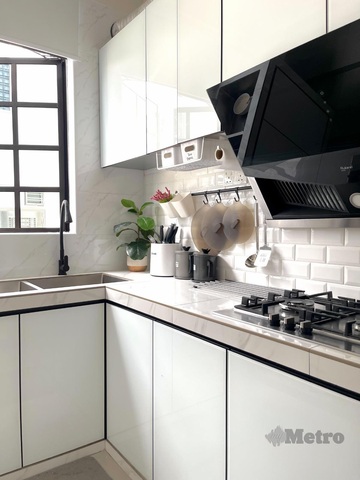
Desa Tiara
Kuchai Lama 58200 KL
$ 912,529
Listed on August 18, 2026
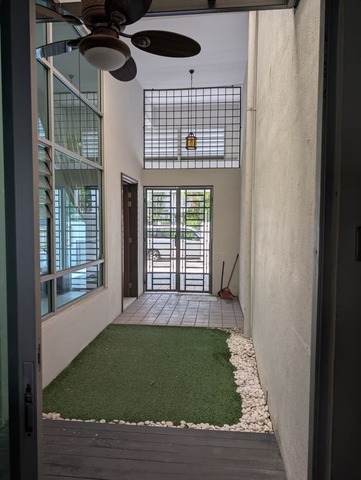
Taman Bukit Mandarina
Jalan Mandarina
$ 592,368
Listed on September 16, 2026
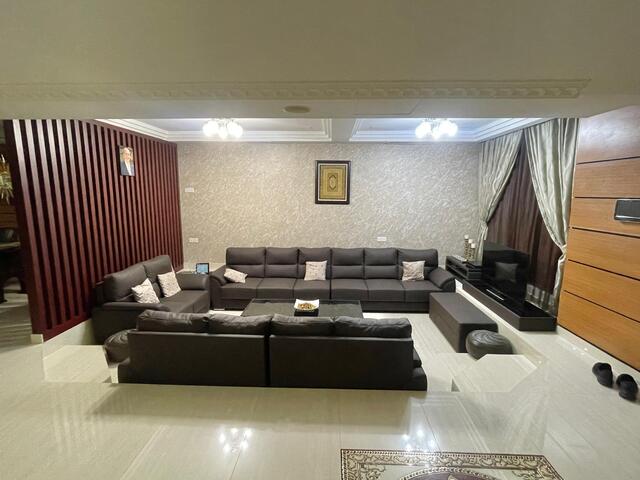
Taman Cheras
Off Jalan Cheras
$ 1,939,300
Listed on August 23, 2026
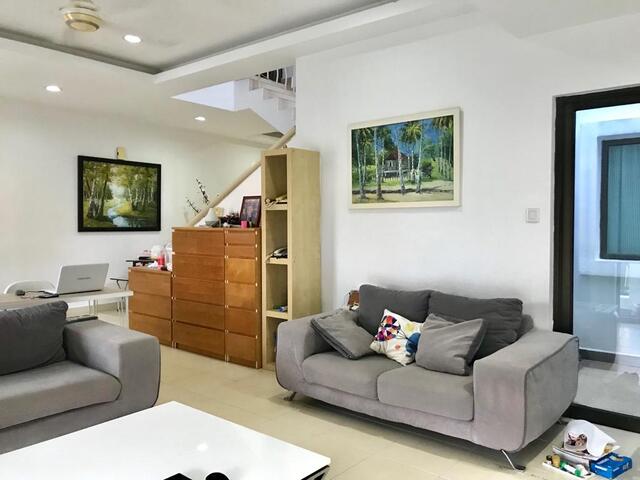
The Peak, Cheras
Jalan Bukit Prima
$ 528,900
Listed on October 5, 2026
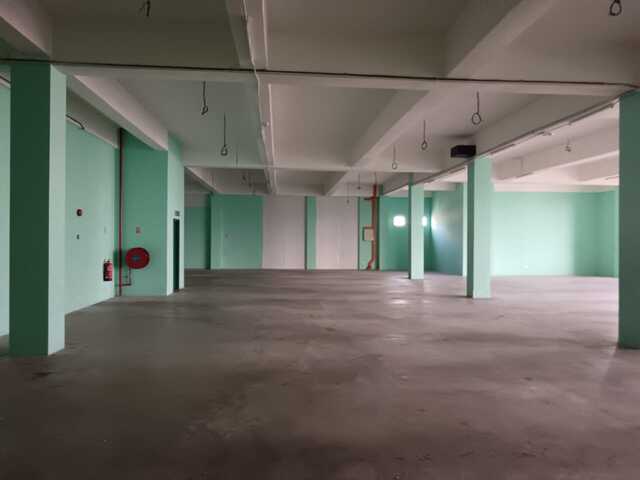
Taman Perindustrian Meranti Jaya
Taman Perindustrian Meranti Jaya 47120 Puchong
$ 21,156 /month
Listed on September 16, 2026
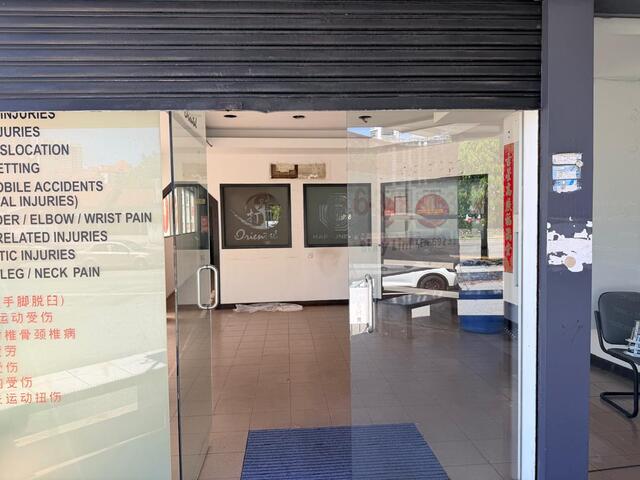
Taman Ayer Panas
Setapak 53300 Kuala Lumpur
$ 4,936 /month
Listed on September 16, 2026
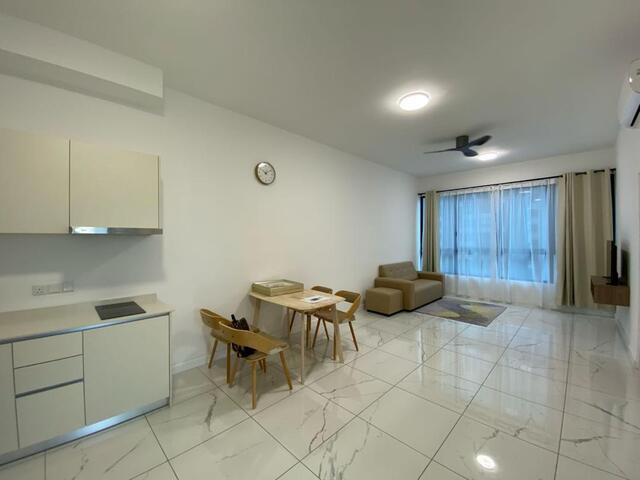
Cubic Botanical
Jalan Pantai Sentral 3
$ 200,982
Listed on August 25, 2026

Taman Bukit Permai, Kajang
Sungai Long 43300 Kajang
$ 370,230
Listed on June 27, 2023
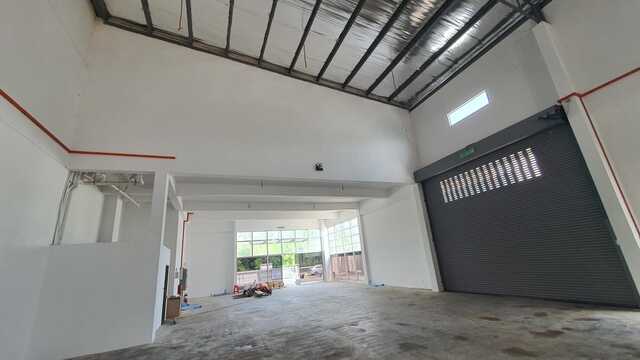
Saujana Technology Park
Taman Saujana Teknologi Rawang 48000 Rawang
$ 3,702 /month
Listed on October 1, 2026
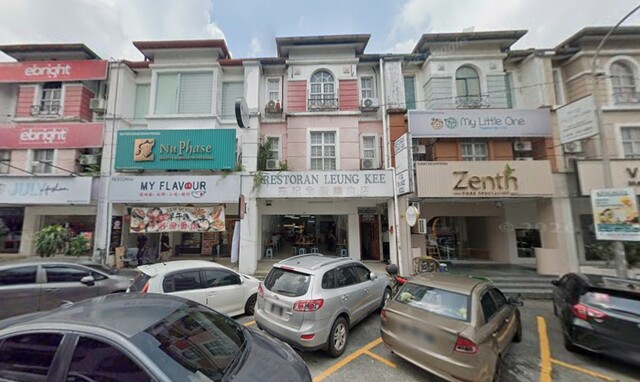
Taipan Business Centre, USJ 10
USJ Taipan,47600 Selangor
$ 4,408 /month
Listed on September 15, 2026
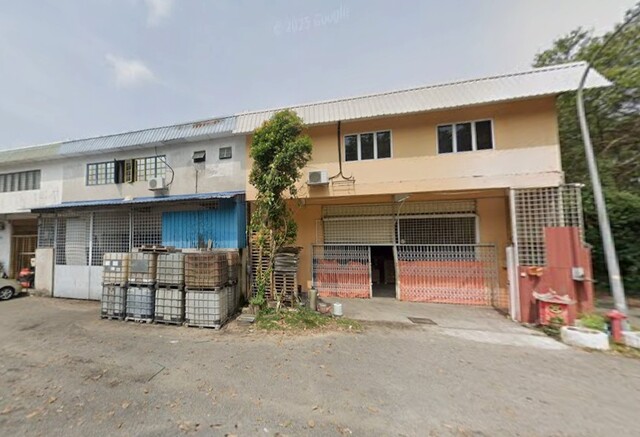
Kampung Baru Balakong
Kampung Baru Balakong, 43300 Seri Kembangan, Selangor
$ 4,055 /month
Listed on October 1, 2026
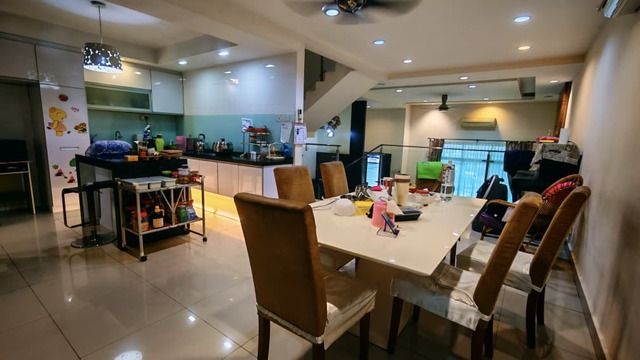
The Peak, Cheras
Jalan Bukit Prima
$ 493,640
Listed on October 5, 2026
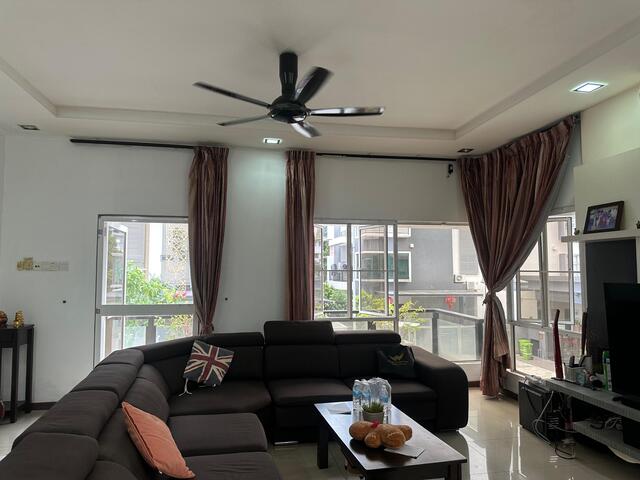
Desa Tiara
Kuchai Lama 58200 KL
$ 952,020
Listed on August 18, 2026

Pavilion Embassy Residence
Jalan Ampang, 55000, Kuala Lumpur
$ 1,305 /month
Listed on March 19, 2025
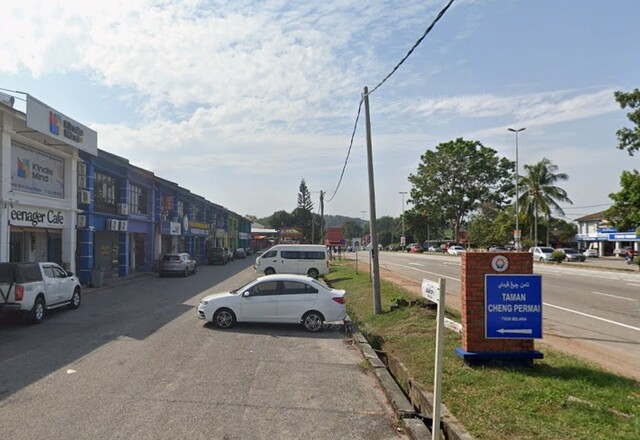
TAMAN CHENG PERMAI
JALAN CP 1, TAMAN CHENG PERMAI
$ 6,241 /month
Listed on August 29, 2026
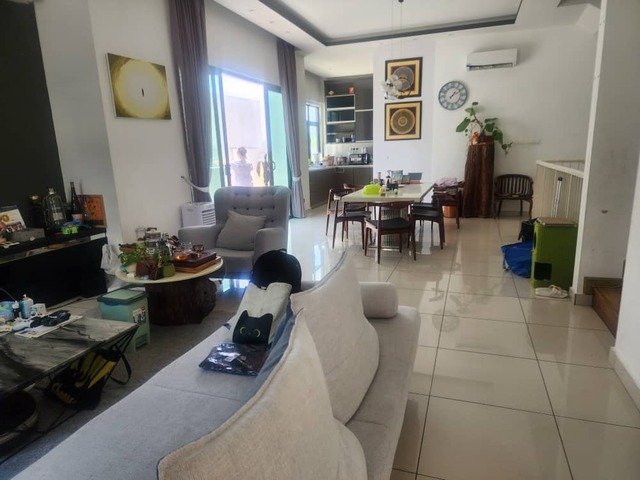
Desa Hill Villas
Jalan 1/125
$ 1,163,580
Listed on August 24, 2026
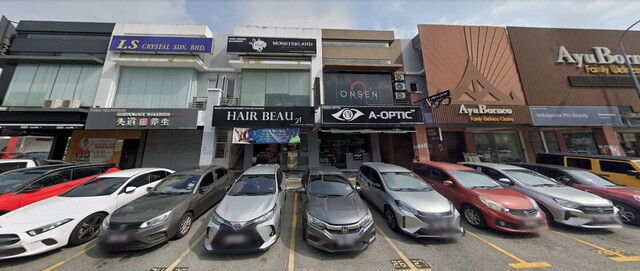
Cheras Trader Square
Dataran Perniagaan Cheras, 43200 Cheras
$ 1,339,880
Listed on August 23, 2026
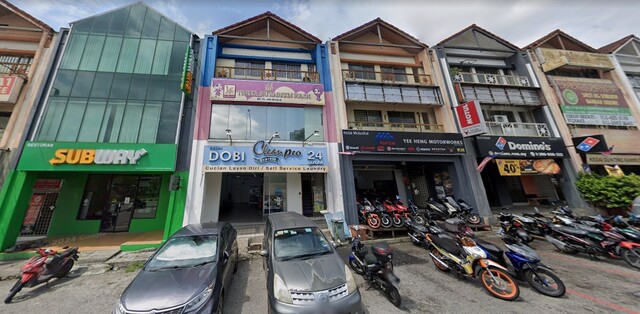
Taman Putra Permai
Taman Putra Permai, 43300 Seri Kembangan
$ 2,997 /month
Listed on September 15, 2026
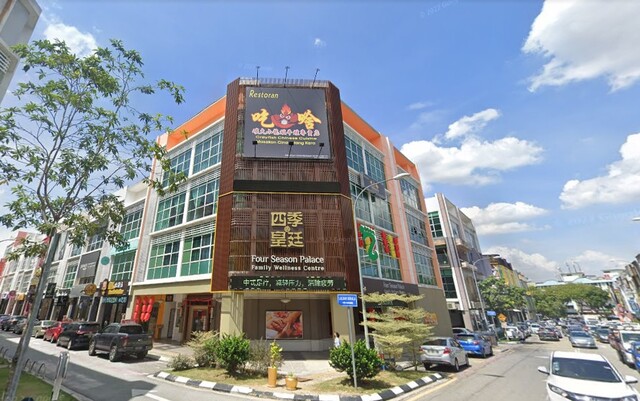
Bandar Baru Sri Petaling
Bandar Baru Sri Petaling, 57000 Kuala Lumpur
$ 6,276,280
Listed on September 16, 2026
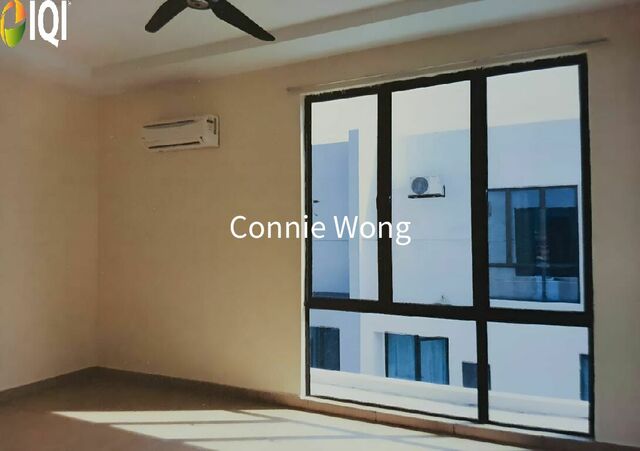
Taman Sinar Mahkota
Jln Sinar Mahkota 1, Taman Sinar Mahkota
$ 511,270
Listed on August 26, 2025
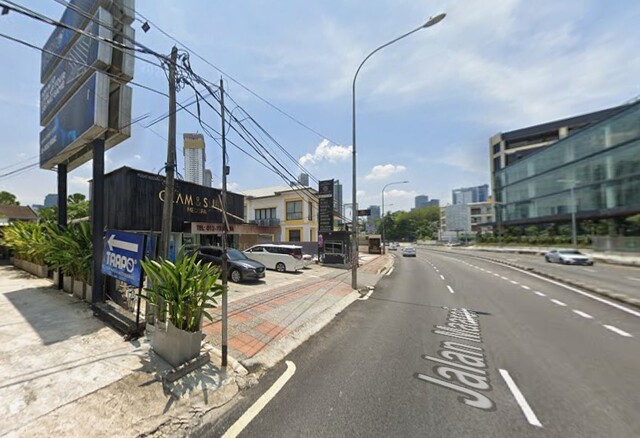
Jalan Maarof
Jalan Maarof 59000 Bangsar, Kuala Lumpur
$ 17,630 /month
Listed on August 23, 2026
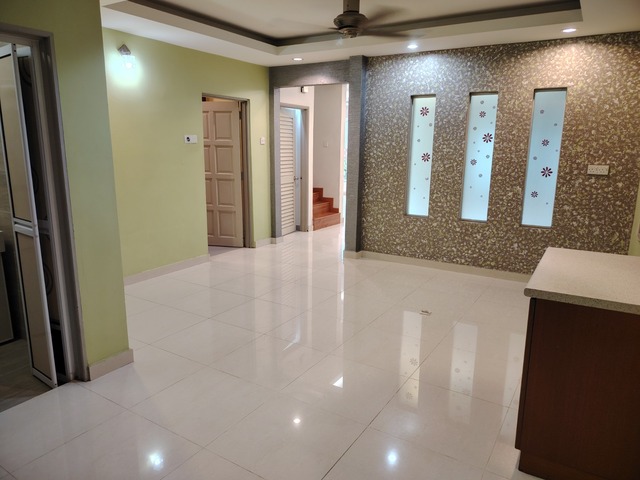
Jalan Suasana, Bandar Tun Hussein Onn
Selangor
$ 486,588
Listed on August 21, 2026
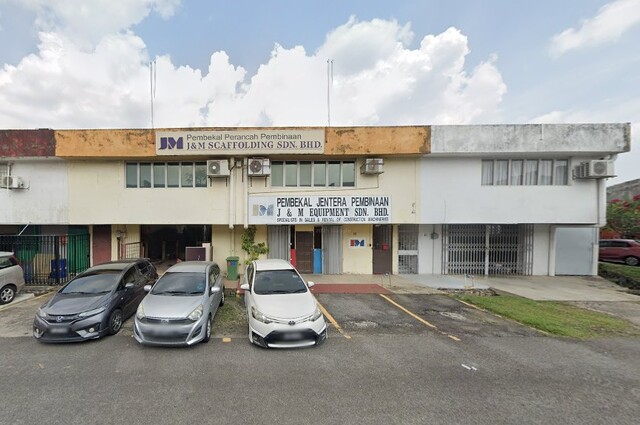
Taming Jaya Industrial Park
Balakong
$ 3,879 /month
Listed on October 1, 2026
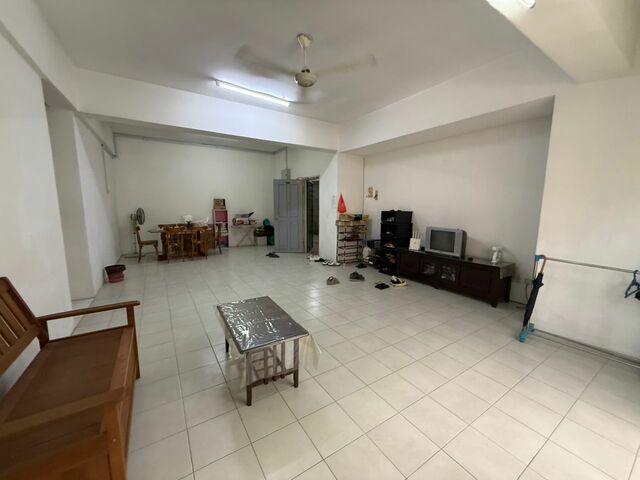
Cypress Condominium
Bandar Sungai Long
$ 176,300
Listed on November 24, 2025
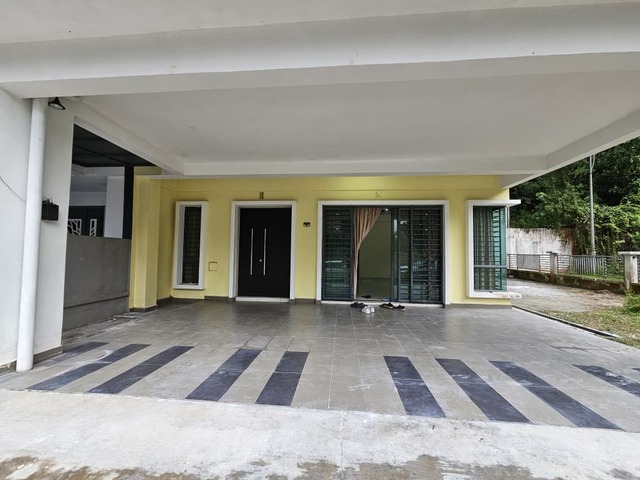
Mahkota Hills
Jalan Mahkota Hills 1; Jalan Mahkota 10; Jalan Mahkota 11
$ 599,420
Listed on August 2, 2026
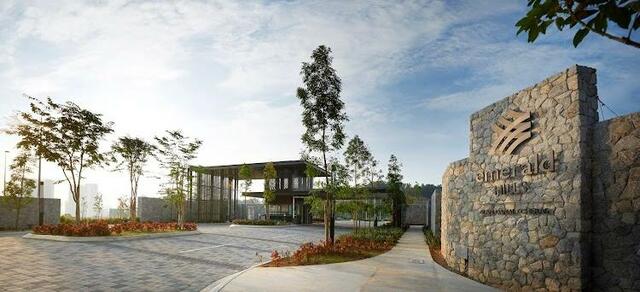
Lakefront Condominium | Emerald Hills @ Alam Damai
Jalan 6/154d, Taman Desa Cheras, Alam Damai
$ 275,028
Listed on July 7, 2026

Pavilion Embassy Residence
Jalan Ampang, 55000, Kuala Lumpur
$ 1,728 /month
Listed on March 19, 2025
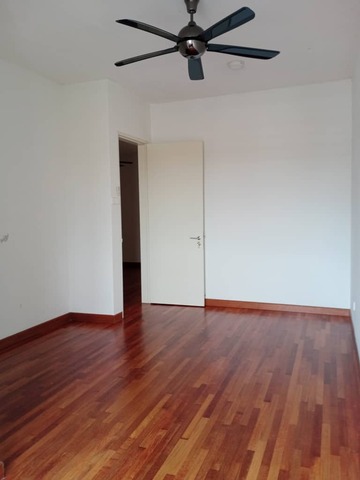
Damai Citra (Damai South)
Lingkaran Damai Citra, 56000 Cheras
$ 433,698
Listed on August 23, 2026
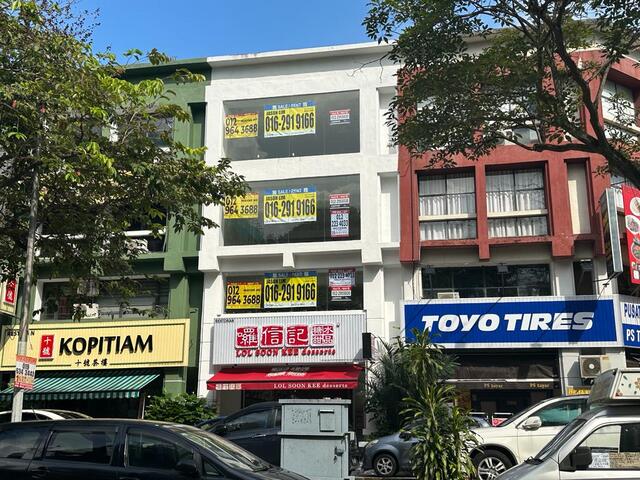
Taman Danau Desa
Taman Desa, 58100 KL
$ 4,584 /month
Listed on September 15, 2026
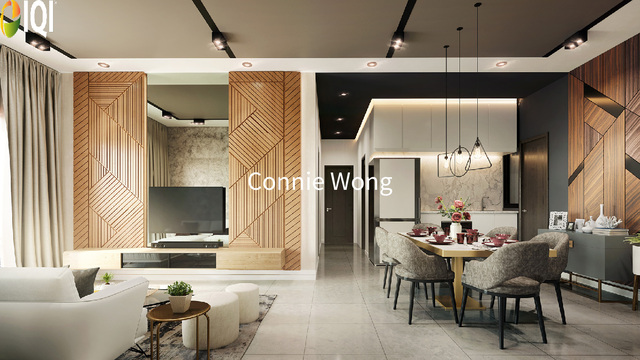
JRK Convena @ Bukit Jalil
JRK CONVENA Lot J-3-1, Pusat Perdagangan Bandar Bukit Jalil, Jalan Persiaran Jalil 1
$ 211,560
Listed on September 12, 2025
Our newly launched projects
Discover the real estate properties in and around Kuala Lumpur, Malaysia. Buy apartment units, landed houses, bungalows, commercial office space, shop lots, and sub-sales with 100% confidence at IQI Global.
 Located in Kubang Semang
Northern TechValley @BKE
Mukim 14, Kubang Semang, 14400 Seberang Perai, Penang, Malaysia
Starting from $ 5,111,120
Listed on January 23, 2026
 Located in Bukit Minyak
Taman IKS Bukit Minyak
Jalan IKS Bukit Minyak Utama, Taman IKS Bukit Minyak, 14100 Simpang Ampat, Penang, Malaysia.
Starting from $ 424,460
Listed on January 23, 2026
 Located in Simpang Ampat
Regalway Industrial Hub (Industrial)
Regalway Industrial Hub, Off Jalan Bukit Panchor, Bukit Panchor, 14100 Simpang Ampat, Penang, Malaysia.
Starting from $ 1,768,289
Listed on January 23, 2026
 Located in Bukit Mertajam
Taman Jasa Ria (Garden Villa)
Jalan Permatang Pasir, Taman Jasa Ria, 14000 Bukit Mertajam, Penang, Malaysia
Starting from $ 394,489
Listed on January 23, 2026
 Located in Bukit Mertajam
Taman Jasa Intan (Garden Superlink)
Jalan Jasa Intan, Taman Jasa Intan, 14000 Bukit Mertajam, Penang, Malaysia
Starting from $ 288,427
Listed on January 23, 2026
 Located in Nibong Tebal
Taman Fajar Permai (Sunrise Terrace)
Jalan Fajar, Taman Fajar Permai, 14300 Nibong Tebal, Penang, Malaysia.
Starting from $ 193,930
Listed on January 23, 2026
Mortgage Calculator
Calculate your estimated month repayment and plan your monthly expenses well.
The mortgage calculator is intended for reference only. Actual amount may vary.
Monthly Payment
Send me the mortgage calculator result

Home Loan Eligibility Calculator
Calculate your potential loan amount and assess your home buying affordability.

Rental Yield
Calculate the potential rental yield and evaluate a property's investment performance.

Down Payment Saving Plan
Create a structured savings plan and determine how much to save monthly for your down payment plan.

Malaysian Property Transaction Fees Calculator
Estimate the total transaction fees and budget accurately for your Malaysian property purchase.
IQI blog & news
Articles specifically curated for your daily digest of local and global real estate news.

5 Oct, 2026
哪家银行FD最高?盘点2026年10月最新银行定期存款利率!
最后更新于: [current_date] 定期存款(fixed deposit,简称FD)是马来西亚最受欢迎的存钱方法之一,因为比起单纯把钱存在银行账户,FD提供更高的年利率。 同时,相较于其他投资产品,如黄金、股票、产业投资信托基金(REITs)或房地产等,定期存款的投资资金更低,安全性和稳定性也更高,适合寻求低风险和资金的投资者。 不过,定期存款的回酬较低,如果想要从FD获得较好的投资回报,除了需要了解它的实际操作方法,以及每个月的优惠利率。 无论你是FD的常客,想要对比各家银行的1月定期存款促销利率,或是刚打算存FD的新用户,这些有关FD的事情一定要知道! 阅读内容:1. 银行定期存款安全吗?2. 定期存款需要存放多久?3. 定期存款期限到了怎么办?4. 定期存款的钱可以取出吗?5. 定期存款的利率怎么算?6. 银行如何派发利息?7. 2026年10月各家银行定期存款利率Hong Leong BankMaybankStandard Chartered BankCIMB BankAmBankOCBC BankPublic Bank 1. 银行定期存款安全吗? 相较股票、基金等投资产品,定期存款的确是更安全和稳定的投资产品。 这是因为马来西亚银行的定存受马来西亚存款保险机构(PIDM)法令所保护,若银行不幸倒闭,PIDM将作出赔偿。 此外,定期存款投资可以确保你的原本资金不会亏损,因此是不少投资小白的入门选择。 2. 定期存款需要存放多久? 当用户在存放定期存款时,就需要决定存放的期限,而这个期限将视每家银行、各个FD配套而有所不同。 一般上,定期存款的期限包括1个月、3个月、6个月或12个月;当然有些配套推出更久的期限,从15个月、24个月、36个月、48个月到60个月。 这也意味着,当用户的FD存放越久,能够获得的利率回酬也会越高。 3. 定期存款期限到了怎么办? 当用户存入定期存款时,一般上都有“是否自动更新”的选项,只要你选择“自动更新”(Auto Renew),在期限到达后会自动继续储蓄FD。 因此建议大家在存FD时,选择“自动更新”,这样就不用担心忘了期限而没有做到储蓄了。 但要注意的是,如果你是因为银行推出促销利率而储蓄FD,那么在期限到达后,利率将自动调回原本的FD利率。 譬如说,Hong Leong Bank普通的FD利率时3%,但这个月推出4%的促销利率,而你也以这个优惠存入FD,期限为一年。 当你的FD一年期限达到后,利率就会自动调回去3%,接下来你的FD回酬也只有3%。 4. 定期存款的钱可以取出吗? 要注意的是,定期存款的储蓄不能随时取出,一旦在特定期限内取出存款,用户将无法获得利率,或是利率减半。 如果在逼不得已的情况下,必须取出存款,用户可能将面临以下情况: 情况1:取出部分存款 FD存款:RM5,000 期限:1年 年利率:3.5% 取出存款:RM2,000 剩余存款:RM3,000最后获得的利率回酬:RM3,000 x 3.5% = RM105 当用户取出部分FD存款,定期存款利率不再以RM5,000的存款计算,而是以剩下的RM3,000存款计算利率。 情况2:取出所有FD存款 FD存款:RM5,000期限:1年年利率:3.5%储存6个月后取出所有存款 如果以情况2来看,这就要视银行的规定或储存FD时的条款,有些FD将会取消所有利率,这也意味着用户将无法赚取任何利率,但有些则获得部分利率。 若以获得部分利率计算,用户将获得: RM5,000 x 3.5% x (183天/365天) = RM87.74 5. 定期存款的利率怎么算? 一般上,我们看到的定期存款利息,如3.4% p.a.,都是年利率(per annum),也就是一年的利率。 如果用户是存FD的期限是一年,那么就可以直接用存款 x 年利率,以计算自己的回酬。 但如果用户是存3个月、6个月或9个月,这时候就需要以天数计算了。 通常银行计算FD的方程式为: 存款 x 年利率 x (期限天数 / 365天) 如果用户存入RM5,000定期存款,年利率为3.5% p.a,期限为6个月,计算方式如下: 一年:365天 6个月:183天 RM5,000 x 3.5% x (183天/365天) = RM87.74 RM87.74就是6个月的FD回酬。 6. 银行如何派发利息? 一般在储存定期存款时,都会提供你以下2个派息的选项: 利息投资进资本存款中(Credit to Principal)取利息,原本的资本再进行投资 (Credit to Account)例子:FD存款:RM5,000年利率:3.5%期限:1年RM5,000 x 3.5% = RM175RM175的利息将添加至RM5,000的FD存款中,成为RM5,175,再进行FD投资。例子:FD存款:RM5,000年利率:3.5%期限:1年RM5,000 x 3.5% = RM175RM175的利息将存入普通银行账户,原本的RM5,000定期存款将继续投资。 7. 2026年10月各家银行定期存款利率 Hong Leong Bank 锁定期定存利率3个月3.50%6个月4.05%12个月3.80%13个月3.55%24个月3.00% 优惠日期:2026年10月1日 - 2026年10月12日 最低存款额:RM1,000 优惠详情与条件:用户需要使用HLB Connect Online网站或HLB Connect App,通过FPX将其他银行的资金转账过来存放。 照片取自Hong Leong Bank官网 Maybank 锁定期定存利率3个月3.58%6个月3.88%12个月3.93% 优惠日期:2026年10月1日 - 10月31日 最低存款额:RM1,000(通过FPX存放),RM10,000(通过银行柜台存放) 优惠详情与条件:用户必须以“Fresh Funds”的方式,通过Maybank2u将钱从其他银行转账至Maybank户口存放,或是前往银行柜台进行存放。 照片取自Maybank官网 Standard Chartered Bank 锁定期定存利率条件 / 加入特别客户行列12个月3.60%成为Standard Chartered Priority Banking客户12个月3.75%成为新的Priority Private客户 优惠日期:2026年10月1日 - 12月31日 最低存款额:RM50,000 优惠详情与条件:想获得3.60%的定存利率,用户需要使用新资金存入12个月定期存款,并且符合其中一个条件:成为Standard Chartered Priority Banking客户,或在Standard Chartered持有至少RM200,000的财富资产(Wealth Assets)。 另一方面,想获得 3.75%的定期存款利率,用户需要使用新资金存入12个月定期存款,并且符合其中一个条件:成为新的Priority Private客户,或向Standard Chartered购买至少RM200,000的新财富产品 (New Wealth Products)。 接着,用户需要通过Standard Chartered网站,以“Fresh Funds”形式将资金存放入活期储蓄账户(CASA)。 照片取自Standard Chartered官网 CIMB Bank 锁定期eFD 定存利率eFD-i 定存利率(期满收益)3个月3.40%-7个月-3.70%12个月3.80%-15个月3.83% 优惠日期:2026年9月29日 - 2026年11月3日 最低存款额:RM1,000 优惠详情与条件:用户需要使用CIMBClicks网站或CIMB OCTO App来存放。需要留意的是,使用e-FD(非穆斯林网上存款)以及eFD-i(穆斯林网上存款)存在锁定期上的区别,可见上述表格知晓利率差别。 照片取自CIMB官网 AmBank 锁定期定存利率促销码3个月3.45%BEST37个月3.75%BEST712个月3.80%BEST12 优惠日期:2026年10月1日 - 2026年10月31日 最低存款额:RM1,000 优惠详情与条件:用户需要使用AmOnline网站或App,通过FPX将其他银行的资金转账过来存放。 照片取自AmBank官网 OCBC Bank 锁定期定存利率6个月3.75%12个月3.85% 优惠日期:2026年10月1日 - 2026年12月31日 最低存款额:RM10,000 优惠详情与条件:这项FD优惠适用于几乎所有客户,包括马来西亚公民、永久居民和非居民(视原籍国而定)。 用户需通过OCBC网上银行或银行柜台,以“Fresh Funds”形式进行存款。 照片取自OCBC Bank Public Bank 锁定期定存利率6个月3.60%9个月3.75%12个月3.70% 优惠日期:2026年10月1日 - 2026年12月31日 最低存款额:RM5,000 优惠详情与条件:这项FD优惠适用于几乎所有客户,包括马来西亚公民、永久居民和非居民(视原籍国而定)。用户需通过Public Bank网上银行或银行柜台,以“Fresh Funds”形式进行存款。 需注意的是,一旦申购Public Bank这项FD优惠,存期内将不允许部分提款。 照片取自Public Bank 除了定期存款,其实还有很多值得考虑的投资产品供你选择。 留守每个月的定存利率优惠,做个精明的投资者! Version: EN, BM 正在寻找保值且回酬高的投资方案?不妨考虑房地产投资!今天就联系IQI,让我们为你找到最佳房地产投资! [custom_blog_form] 延伸阅读: 什么是Refinance?房贷未还清也能这样省利息、提取现金! 8个我不说你不知的隐形消费!Cut掉这些费用轻松省出“头期” 资金不多的新手小白也能投资房地产?10大马来西亚 REITs 你必知!

2 Oct, 2026
10月最新房贷利率最低仅2.88%!教你如何计算房屋贷款利率!
最后更新于: [current_date] Version: EN, BM 作为一名房奴,当你的房屋贷款(house loan)被银行批准后,紧接下来要面对的就是巨额的房贷利息(house loan interest)! 想早点还清房贷,借贷者可以通过观察各银行的房贷利率,选择最适合自己财务能力的贷款配套。 现在,就让我们一起来看看马来西亚各大银行10月推行的房屋贷款利率吧! 阅读内容:房屋贷款利率怎么算? 其他影响房贷利率的因素2026年马来西亚房屋贷款利率是多少? 1. Maybank2. Bank Islam Baiti Home Financing-i3. Standard Chartered Saadiq My HomeOne-i4. Bank of China Housing Loan5. Public Bank 5HOME Plan6. CIMB HomeFlexi Smart7. Affin Home Invest-i借贷人应该如何比较各家银行的房贷利率?如何规划和比较房贷利率?第一步:确认你的贷款基本参数第二步:系统性地比较各家银行房贷第三步:参考真实经验与专业建议 房屋贷款利率怎么算? 自2022年8月1日起,马来西亚的房屋贷款利息将依据标准基准利率(Standardised Base Rate, 简称SBR)来调整。 由于标准基准利率(SBR)与国家银行的隔夜政策利率(OPR)紧密相关,因此所有银行都采用相同的利率。这意味着,一旦OPR调整,SBR也会随之调整。 标准基准利率(Standardised Base Rate)+ 利差(Spread)= 有效贷款利率(Effective Lending Rate) 假设你的贷款金额为 RM300,000,贷款期限为 30 年,贷款利率是3.50%,以下则是年利息和月利息的计算方法: 年利息金额:RM300,000 x 3.50% = RM10,500 月利息金额:RM10,500 / 12 = RM875 因此,每月的还款数额会是本金,并额外加上 RM875 的利息。 其他影响房贷利率的因素 除了国家银行调整OPR将影响各家银行的房贷利率,其实房贷利率还会因以下几个因素而出现变化,包括: 经济状况:通货膨胀与经济的稳定性都将对房贷利率产生影响。 借贷人的信用评分:借贷人的信用评分越高,通常能获得更低的利率。这也意味着,如果两个人获得RM500,000的贷款,但可能借贷人A的信用评分比借贷人B更高,而获得更低的利率。 贷款期限:如果贷款年限越长,银行需要支付更多的时间与成本,从而增加潜在风险(如利率波动、违约风险),因此利率也会相对提高。 2026年马来西亚房屋贷款利率是多少? 以下是马来西亚各大银行在10月推行的房屋贷款利率: 1. Maybank Maybank为房屋贷款者提供多种房屋贷款配套选择,让贷款者根据不同的需求,选择合适的配套和房贷利率。 其中最常见的房屋贷款配套包括: Maybank Islamic HouzKEY 图片来源:Maybank 年利率:2.88%起 贷款期限:最长可达35年 锁定期:一年 所需费用 逾期罚款未偿金额的 1% 年利率手续费无提前结算费无 仅限18至70岁的马来西亚公民,且需为受薪雇员或自雇人士。申请时,不可拥有超过一笔住房贷款,最多允许3名担保人。 用户可浏览 Maybank 网站获取更多详情。 Maybank Maxi Home 年利率:4.35%起 贷款期限:最长可达35年 锁定期:3年 任何国家、年龄介于18至70岁的受薪雇员或自雇人士都可以申请。 所需费用 逾期罚款未偿金额的 1% 年利率房贷提款费每次提款的费用为RM25手续费无每月费用RM5提前结算费3 年保留期内为3%赎回函费用每次请求的费用为RM50公积金提款费信函每次请求的费用为RM10 保险种类 MRTA 想获取更多详情,可浏览 Maybank 网站。 2. Bank Islam Baiti Home Financing-i 图片来源Bank Islam官网 年利率:3.55%起 贷款期限:最长可达35年 锁定期:无 最低年收入为RM24,000的马来西亚公民,18岁以上,不是破产人士且无任何法律纠纷。申请者至少3年稳定工作或经营盈利业务,并且有至少1年的良好还款记录。 所需费用 逾期罚款未偿金额的 1% 年利率手续费无提前结算费无赎回函费用每次请求的费用为 RM50公积金提款费信函每次请求的费用为 RM20 保险种类 Mortgage Reducing Term Takaful (MRTT) / Mortgage Level Term Takaful (MLTT) (强制性) HOT (Houseowner/Householder Takaful Plan) (可自选) Houseowner/Householder Takaful(可自选) 欲了解更多详情,请浏览 Bank Islam 网站。 3. Standard Chartered Saadiq My HomeOne-i 图片来源:Standard Chartered 年利率:3.9%起 贷款期限:最长可达35年 锁定期:无 最低月收入为RM4,000,年龄在21至70岁之间,任何国籍的受薪雇员或自雇人士均可申请。 所需费用 逾期罚款未偿金额的 1% 年利率手续费无每月费用RM10提前结算费无赎回函费用每次请求的费用为 RM50公积金提款费信函每次请求的费用为 RM20取消费如果银行承担费用,则为贷款金额的2% 保险种类 火灾回教保险(Fire Takaful) MRTT 用户可到 Standard Chartered 网站获取更多详情。 4. Bank of China Housing Loan 图片来源:Bank of China Malaysia 年利率:3.88%起 贷款期限:最长可达35年 锁定期:3年 最低年收入为RM60,000,年龄在18至70岁之间,马来西亚公民或永久居民、在马来西亚工作的外国人均可申请,需为受薪雇员或自雇人士。 所需费用 逾期罚款未偿金额的 1% 年利率手续费无提前结算费预付款或全额还款需支付2.25%费用(自贷款首次发放日起的前3年内) 保险种类 Fire Insurance (强制性) Houseowner Insurance (可自选) MRTA(可自选) MLTA(可自选) 想获取更多详情,可浏览 Bank of China 网站。 5. Public Bank 5HOME Plan 图片来源:Public Bank 年利率:4.22%起 贷款期限:最长可达35年 锁定期:3年 最低年收入为RM24,000,年龄在21至70岁之间,任何国籍的受薪雇员或自雇人士均可申请。 所需费用 逾期罚款未偿金额的 1% 年利率提款费RM50手续费RM50 - RM200(取决于受批准贷款额)提前结算费3 年保留期内为 2% 至 3%,具体取决于贷款规模赎回函费用每次请求的费用为 RM50公积金提款费信函每次请求的费用为 RM20 保险种类 MRTA 想获取更多详情,可浏览 Public Bank 网站。 6. CIMB HomeFlexi Smart 图片来源:CIMB 年利率:4.35%起 贷款期限:最长可达35年 锁定期:无 最低年收入为RM24,000,年龄在18至70岁之间,任何国籍的受薪雇员或自雇人士均可申请。 所需费用 逾期罚款未偿金额的 1% 年利率提款费每一次RM25,不限任何金额手续费无提前结算费无赎回函费用每次请求的费用为 RM50公积金提款费信函每次请求的费用为 RM20 想获取更多详情,可浏览 CIMB 网站。 7. Affin Home Invest-i 图片来源:Affin 年利率:4.36%起 贷款期限:最长可达35年 锁定期:无 最低年收入为RM24,000,年龄在18至70岁之间,任何国籍的受薪雇员或自雇人士均可申请。 所需费用 违约金每年1%提款费RM25,账户内的预付金需达到至少RM5,000手续费无提前结算费具体条款以银行协议为准赎回函费用RM50公积金提款费信函RM20 保险种类 屋主回教保险(House Owner Takaful) MRTT 想获取更多详情,可浏览 Affin 网站。 借贷人应该如何比较各家银行的房贷利率? 就如以上的房屋贷款,各家银行所提供的利率都有所不同。 那作为精明的借贷人,应该如何选择最适合自己的房贷利率,才能进一步降低借贷成本、减少自己的负担呢? 如果你打算向银行申请房屋贷款购买房子,在申请之前不妨先考虑以下3个重点: 查看有效借贷利率(ELR)和利差:比较总借贷成本 了解附加费用:注意可能产生的额外费用 仔细阅读产品披露声明(PDS):该文件提供有关贷款的关键详细信息 如何规划和比较房贷利率? 在申请房屋贷款之前,单纯比较各家银行的房贷利率是不够的,而是需要做好完整的财务规划,才能确保买房后不会面临财务困难。 第一步:确认你的贷款基本参数 在比较任何银行房贷利率之前,先明确: 房产价格 贷款金额(Loan Margin) 贷款年限(最长35年,或至70岁) 每月可负担的贷款比例(建议不超过收入的40%) 此外,建议也使用房屋贷款计算器来预估每月的供款,以了解不同利率的供款。 第二步:系统性地比较各家银行房贷 在比较各家银行的房屋贷款利率时,不要只是看数字的高低,而是要看整体的房贷配套: 比较贷款利率类型:浮动利率或固定利率,同时也要查看前几年是否有优惠利率、了解锁定期(Lock-in period) 留意提前还款的条款:一般上房屋贷款的锁定期为3至5年,建议先了解提前结清贷款是否有罚款,因为这会影响未来再融资或出售房产的灵活性。 了解贷款的灵活性:大马常见的房屋贷款类型包括:a. 灵活贷款(Flexi Loan):可随时存入多余资金以减少利息。b. 半灵活贷款(Semi Flexi Loan):可额外还款,但提款可能需要申请。c. 定期贷款(Term Loan):每个月必须偿还固定的贷款数额,不能额外偿还贷款额,即使支付额外的资金也不能节省利息或提领出来。 房贷保险与额外费用:一般上房屋贷款会附上保险,以保障你在发生意外后,帮助你偿还剩下的房贷。房贷保险分为:a. 递减式房屋贷款保险(MRTA)b. 抵押定额式房屋贷款保险(MLTA) 此外,你还需要计算其他费用,包括律师费、文件印花税等,这些都将影响你的贷款成本。 第三步:参考真实经验与专业建议 在决定买房时,建议先参考其他借贷人的经验,从而大约了解买房前期的总费用和买房后的负担,同时也建议咨询贷款专员或财务顾问,以确保贷款结构符合你的财务规划。 由于利息浮动将直接影响未来20年的还款金额,因此在了解各大银行提供的房屋贷款利率及详细信息后,借贷人应根据自身条件选择最合适的贷款方案,以获得最大效益。 当然,还清房贷后,千万别忘了办理后续手续,只有这样房子才真正属于你哦! 买房费用太大?担心一辈子只能买一间房?在IQI,只要你努力达成业绩,实现成为包租公/包租婆的梦想绝对不成问题! 现在就填写表格与我们联系! [custom_blog_form] 延伸阅读: 国家银行连续7次维持OPR在3%,对你的房屋贷款有什么影响? 马六甲房价竟然是全马最低?本地人和外国人都爱选这3区投资买房! 哪家银行FD最高?盘点2026年10月最新银行定期存款利率!
2 Oct, 2026
IQI Youth Connect 2026: 年轻人如何迎接 AI 驱动的未来?
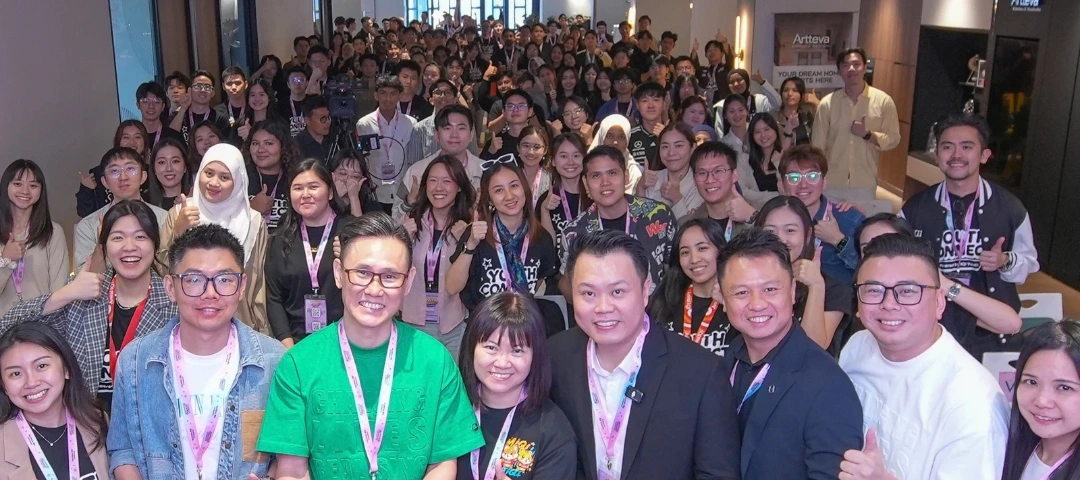
2026年8月22日,IQI Youth Connect 2026 在吉隆坡 Millerz Square 的 IQI 总部圆满落幕。这场由居外 IQI (Juwai IQI)旗下 IQI Youth 青年计划推动的一日活动,共吸引超过150名参与者,其中52%是在籍大学生。 当天的分享围绕人工智能(AI)、内容营销与创业展开,而这些课题,也正好对应年轻人目前面对的就业变化。 马来西亚青年失业率已达到全国平均水平的三倍以上,加上 AI 正逐渐改变工作、创作和创业的方式,年轻人需要具备什么能力,才能跟上职场变化,也成为越来越实际的问题。 这也正是 IQI Youth Connect 2026 想讨论的重点:当工作方式不断变化,新一代该如何为接下来的职场做好准备? 虽然距离首场 Youth Connect 已经过去一个多月,但作为 IQI 首次举办的青年活动,当天的分享与交流也让不少参与者有所收获。让我们一起回顾这场活动的内容重点! 1. 青年失业率是全国平均水平的三倍以上 根据马来西亚统计局(DOSM)的数据,2026年3月,马来西亚整体失业率为2.9%,接近近十年来的最低点。相比之下,15岁至24岁青年的失业率达到10.2%,涉及约29万名年轻人。 另一组数据则反映出青年就业的另一个问题 。 马来西亚统计局指出,2026年第一季度,在已就业的学位及文凭持有者中,有35.2%属于技能相关就业不足(Skill-related underemployment)。 也就是说,超过三分之一已经就业的大学及文凭毕业生,目前从事的工作与其学历或技能水平并不完全匹配。 指标 数据 全国失业率 2.9% 15岁至24岁青年失业率 10.2% 15岁至24岁失业青年人数 约290,000人 学位及文凭持有者的技能相关就业不足率 35.2% 资料来源:马来西亚统计局,Labour Force Report, March 2026 and Q1 2026。 从这些数据来看,问题并不完全在于工作机会不足,而是毕业生所掌握的技能与企业目前的招聘需求之间存在落差。 随着 AI 逐渐自动化许多原本由职场新人负责的常规工作,这种落差也变得越来越明显。 2. 活动以实际演示为主,而非单纯演讲 IQI Global 联合创始人兼董事经理 Daniel Ho 以主题演讲为活动揭开序幕。他在分享中提到,随着科技不断改变各个行业与职业发展,新一代也需要更快适应这些变化。 与以励志演讲为主的活动不同,Youth Connect 当天也安排了现场演示、主题分享、小组讨论,以及参与者可以直接运用的实用框架。 内容包括 AI 辅助内容创作、如何扩大数码受众、提升工作效率、经营个人品牌和创业。 参与者也获得了 AI 提示词资料库(AI prompt library)、内容创作蓝图(Content creation blueprints),以及一套 21 天成长框架(21-day growth framework)。 3. 参与者在 Youth Connect 2026 学到了什么? Youth Connect 安排了多场实用工作坊,并邀请来自 AI、内容创作、营销与创业领域的从业者,结合实际案例与自身经验分享。 a. AI 与内容增长 IQI 集团副总裁 Aaron Siow 主持了一场名为 “2,000 Followers in 30 Days: The Claude System You Can Copy” 的现场分享。 分享中,他示范了如何将 Claude 等 AI 工具融入一套可重复使用的内容与受众增长系统,让参与者更清楚地了解 AI 如何协助内容规划与执行。 参与者也获得了一系列实用资料,包括 AI 提示词资料库(AI prompt library)、内容创作蓝图(content creation blueprints),以及一套 21 天成长框架(21-day growth framework)。 b. Agentic AI 与未来工作模式 DJC AI Sdn Bhd 首席执行官兼 IQI 集团副总裁 Dave Chong 在 “One Person, One AI Team: How Agentic AI Changes the Way We Work” 的分享中,向参与者介绍 Agentic AI(代理式人工智能)。 这场分享主要介绍了多智能体工作流程(Multi-agent workflows),让参与者了解不同 AI 系统如何分工协作,完成一连串有关联的任务。重点也指出并不只是把单一工作自动化,而是借助科技提高产出,并建立更有效率的工作方式。 c. 个人品牌与创业 内容创作学院联合创始人 Bryan Low 则以个人品牌为题进行分享。 凭借超过155万名粉丝,以及在不同数码平台累积超过1.5亿次观看的经验,他从实际经历出发,谈年轻人该如何经营自己的个人品牌。 内容包括年轻职场人士如何在网络上找到自己的定位、扩大受众,并进一步了解不同的内容变现方式。 随着创作者经济(Creator Economy)持续发展,越来越多人开始通过网络建立知名度,并发展出不同收入来源 。 因此,这场分享也鼓励参与者把个人品牌视为可以长期累积的职业资产,而不只是社交媒体上的个人形象。 4. Youth Connect 2026 邀请了哪些嘉宾? Youth Connect 邀请了来自管理、内容创作、营销与科技领域的从业者,从不同角度分享 AI 时代下的职业发展经验。 除了 Daniel Ho、Bryan Low、Dave Chong 和 Aaron Siow,活动也邀请了全职自由职业者兼内容创作者 LeAnn Lai (左二)。她曾培训超过300名企业家,并建立了拥有超过15万粉丝的社群。 IQI Global 社交媒体团队负责人 Hannah Teh (左三)则结合过去的营销活动经验进行分享,其中部分活动曾触及超过230万人 。 IQI Global 数字营销经理兼内容创作者 Jasmine Yap(左一)则主持了有关受众互动与数码增长的讨论。 不同讲者的分享,也让参与者看到数码创业并不只是做内容,还涉及 AI 工具、如何扩大受众,以及怎样建立自己的网络形象。 5. Networking 也是活动的重要环节 除了分享与讨论,Youth Connect 还安排了多次交流机会。 参与者可以在午餐、互动式 AI 问答环节(AI Trivia Session)以及活动尾声的下午茶期间,与导师、房地产中介团队负责人,以及其他有相似发展方向的年轻人交流。 这样的安排也反映了马来西亚职场新人面对的一项现实情况:不少工作机会来自推荐与人脉关系,而这正是许多应届毕业生较为欠缺的一部分。 6. IQI Youth 关注的不只是技能,也包括人脉与个人影响力 通过 IQI Youth 青年计划,居外 IQI 希望为马来西亚年轻人提供一个学习与交流的平台,让他们在提升技能的同时,也有机会拓展人脉,并了解科技正在如何改变职场与创业环境。 Youth Connect 把 AI、营销、创业、内容创作和人际交流放在同一场活动中讨论。因为年轻人要真正把所学转化成职场机会,除了专业技能,也需要沟通能力、适应能力、自信,以及一定的个人曝光度。 青年失业是一个全国性的课题,单靠一场由私人领域举办的活动,当然不足以改变整体情况。 但对参与者来说,能不能在进入职场前就真正接触和使用 AI,知道这些工具可以怎样帮助自己,差别其实很实际。 而对于这次没能参与 Youth Connect 的年轻人来说,机会也还没结束。 如果你对 Youth Connect 感兴趣,却错过了8月举办的首场活动,也不用太失落。 今年12月,Youth Connect 将再次与大家见面! 想参与下一场 Youth Connect,记得留意 IQI 的最新消息。 如果你希望了解IQI如何结合房地产专业知识、科技工具和全球网络,打造更现代化的房地产事业,欢迎点击下方链接,进一步了解IQI的职业发展机会。 [custom_blog_recruit_form] 延伸阅读: 《居外IQI国际峰会2026》与《IQI至尊荣誉之夜2026》双典同庆,圆满落幕! Z世代职业重置:年轻人成为房地产中介,以此实现收入与时间自由? 房地产中介怎么运营小红书?IQI社媒运营手册教你标题、选题与避坑技巧!
22 Sep, 2026
IQI 雪隆区是谁?带你了解 IQI 房地产中介服务与事业平台!
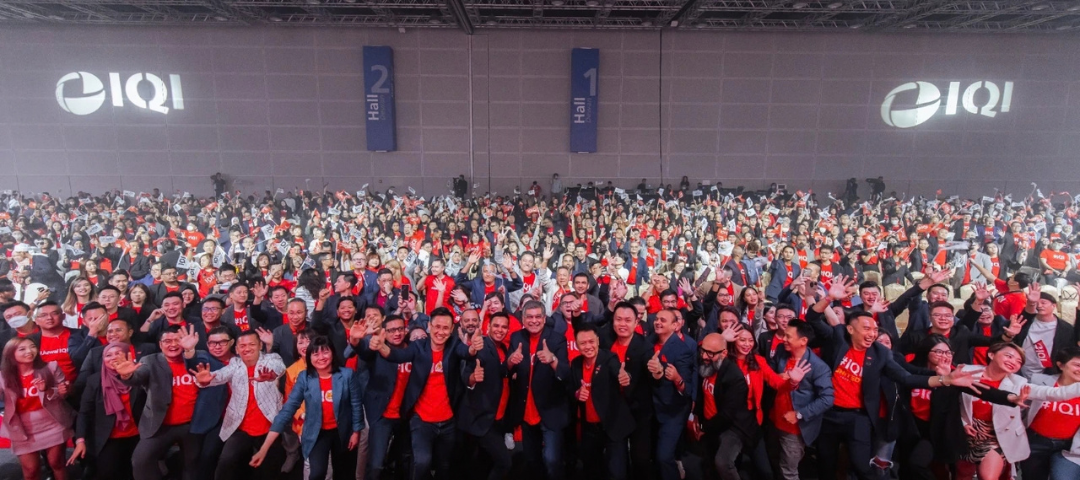
Version: EN, BM 在吉隆坡与雪兰莪寻找理想房产,看似只是选择一个地点和单位,但实际上背后涉及市场分析、价格判断、交易流程以及未来发展潜力。 无论你是首次购房者、希望出售房产的业主,还是寻找投资机会的买家,一个值得信赖的房地产中介团队,都能让整个过程更加简单和安心。 作为马来西亚领先的房地产网络之一,IQI 雪隆区团队结合本地市场经验、全球资源以及科技工具,为客户提供从买房、卖房到房地产投资的一站式服务。 关键摘要: 1. 认识 IQI 雪隆区:连接本地市场与全球房地产资源的专业团队 IQI 雪隆区是 IQI 全球房地产网络位于吉隆坡的专业团队,专注服务吉隆坡及雪兰莪房地产市场。凭借本地市场经验、全球网络资源以及科技工具,IQI 协助买家、卖家和投资者寻找更适合自己的房地产机会。 2. IQI 不只是卖屋子,而是提供完整房地产解决方案 从首次购房、家庭置业、出售物业,到房地产投资规划,IQI 雪隆区房地产中介团队都会根据客户需求提供市场分析、物业建议以及交易流程支持,让房地产决定更加简单和安心。 3. 结合房地产专业知识与科技,提升现代房产体验 作为一家房地产科技公司,IQI 结合数字化平台、AI 工具和全球房地产网络,帮助房地产中介提升服务效率,同时让客户能够更快速、更透明地获取房地产资讯与专业建议。 4. IQI 雪隆区不仅服务客户,也是房地产人才发展的事业平台 除了提供房地产服务,IQI 雪隆区也为希望进入房地产行业的人士提供培训、团队支持以及科技资源,帮助新人和专业人士建立长期发展的房地产事业。 带你认识 IQI 雪隆区!1. IQI 雪隆区是什么?2. 为什么选择 IQI 雪隆区的房地产中介?3. IQI 雪隆区提供哪些服务?4. 为什么需要专业的本地房地产团队助你找房?5. IQI 雪隆区如何改变我们的房产体验?6. IQI 雪隆区是展开房地产事业的平台7. 常见问题(FAQ): 1. IQI 雪隆区是什么? IQI 雪隆区是 IQI 全球房地产网络位于吉隆坡的办事处,专注服务吉隆坡和雪兰莪的房地产市场。 你可能是第一次认识 IQI—— IQI 源于马来西亚,并已发展成为连接全球房地产市场的平台。 IQI 拥有超过 65,000 名专业的房地产中介,办事处覆盖超过 35 个国家,帮助不同地区的买家、卖家和投资者寻找合适的房地产机会。 IQI 总部位于吉隆坡,而 IQI 雪隆区的办事处也在总部,位于旧巴生路(Old Klang Road)Millerz Square 的商业楼 Tower D 内。 无论你是想在吉隆坡购买第一套房子,或是想在雪兰莪寻找适合家庭居住的住宅,或是想投资具有增长潜力的房地产,又或是想寻找合适买家出售物业,IQI 雪隆区的中介团队都会根据你的需求,提供专业建议和市场分析,更是助你一步步达成目标。 2. 为什么选择 IQI 雪隆区的房地产中介? 无论是买房、卖房或投资房产,都是重大的决定。 整个流程包含各种细节,从了解市场价格、区域发展、未来潜力,以及整个交易流程,都是需要做足功课的。 而寻找一名专业的房地产中介,就像拥有“房地产老师”在身旁,他们熟悉房产市场,并于时并进,了解最新的房产资讯,能够提供建议,陪伴你完成整个过程。 同时,IQI 雪隆区也结合了 IQI 全球房地产网络的优势,让客户不仅能够获得本地市场资讯,也能接触更广泛的房地产机会。 因此,对于本地买家、投资者,或希望在马来西亚置业的海外客户来说,这意味着可以获得更全面、更有依据的房地产建议。 3. IQI 雪隆区提供哪些服务? IQI 雪隆区的房地产中介团队可以提供全面的房地产服务,从买房、卖房到投资咨询,帮助客户在每一个重要决定中更加安心。 i. 买房 对于许多买家来说,购买房产可能是一生中最大的投资之一。 除了考虑预算,还需要了解地点、社区环境、未来发展以及物业是否符合长期需求。 IQI 雪隆区的中介团队会根据客户的生活需求和购房目标,协助寻找合适的房地产选择,包括: 首次购房者(也称首购族)寻找适合自己的第一套房 家庭寻找更舒适的居住空间 外籍人士了解马来西亚房地产市场 投资者寻找具有发展潜力的物业 从新推出的发展项目、二手房产,到高端住宅和商业物业,IQI 房地产中介都会协助客户比较不同选择,并提供市场分析,让客户能够做出更适合自己的决定。 如果你正在雪隆区寻找房产,但需要专业帮助,欢迎联系IQI雪隆区的专业房地产中介助你寻得理想房产! 联系 IQI 雪隆区的房地产中介助你买房 ii. 卖房 出售房产并不只是将物业放上市场等待买家出现。 一个有效的出售过程,需要了解当前市场情况、制定正确的推广方式,并找到真正有兴趣的潜在买家。 IQI 雪隆区的团队可以协助业主: 分析目前市场价格 了解物业定位 制定合适的营销策略 接触更多潜在买家 协助价格谈判和交易流程 凭借 IQI 广泛的房地产网络和数字化工具,业主能够获得更有效率的销售支持,提高物业曝光机会,并更顺利完成交易。 想了解更多关于卖房流程,以及 IQI 如何协助您在雪隆区找到合适买家的更多资讯?点击了解更多! 联系 IQI 房地产中介助你卖房 iii. 房地产投资咨询 房地产投资不仅是购买一套物业,更重要的是了解这项投资是否符合长期目标。 不同区域、不同类型的物业,都可能拥有不同的投资表现。因此,在做决定之前,了解市场趋势和未来发展非常重要。 IQI 雪隆区团队可以协助投资者分析: 区域发展潜力 租赁市场需求 物业价格趋势 长期升值机会 例如,同样位于雪隆地区的两个物业,可能因为交通规划、商业发展或周边设施不同,而拥有不同的投资价值。 通过结合本地市场经验和房地产数据分析,IQI 希望帮助投资者更全面地了解市场,而不是单纯根据短期价格做决定。 联系 IQI 房地产中介助你投资计划 4. 为什么需要专业的本地房地产团队助你找房? 寻找适合自己的房产,并不只是选择一个地点和单位,还需要考虑市场价格、区域发展、交通便利度以及未来价值等因素。 尤其是在雪隆区,不同地区的发展潜力和物业价值各有差异。 因此,一个专业的本地房地产团队,能够帮助你更全面地了解市场,分析不同选择的优势,让买房决定更加有依据。 i. 了解市场,找到真正适合自己的区域 每个人寻找房产的目标都不同。 对于自住买家来说,可能更关注: 上班地点距离 家庭生活便利度 学校和社区环境 日常生活配套 而对于投资者来说,则可能更关注: 区域发展潜力 租赁需求 未来增值空间 市场趋势 专业的房地产中介能够根据你的需求,分析不同区域的特点,帮助您缩小选择范围,避免在大量房源中花费过多时间。 举个例子,吉隆坡城中城(KL City Centre)、满家乐(Mont Kiara)和孟沙(Bangsar)等地区可能更适合重视城市便利和国际生活方式的买家。 而八打灵再也(Petaling Jaya)、梳邦再也(Subang Jaya)、蒲种(Puchong)和莎阿南(Shah Alam)等成熟社区,则可能更符合家庭长期居住需求。 ii. 避免信息差,让房地产决定更有依据 房地产市场的信息很多,但并不是所有资讯都容易理解。 买家可能会遇到: 不清楚市场合理价格 不知道区域未来发展方向 难以比较不同物业的价值 不熟悉购房流程和文件要求 一位专业的本地房地产中介,可以帮助您整理这些信息,并提供更实际的市场观点。 他们不仅了解目前市场上的房源,也能根据经验判断一个物业是否符合您的预算、需求和长期规划。 iii. 从寻找房产到完成交易,全程提供支持 购买房产并不是看到喜欢的单位后马上决定,而是一个需要多个步骤的过程。 专业的房地产团队可以协助: 了解你的需求和预算 推荐合适的物业选择 安排看房与提供市场分析 协助价格沟通与谈判 跟进交易流程 这样可以让整个买房过程更加清晰,减少因为不了解市场或流程而产生的不必要压力。 对于 IQI 雪隆区而言,房地产服务的重点不仅是帮助客户找到一套房子,而是希望通过专业知识和本地经验,帮助客户找到更符合生活目标或投资计划的房地产选择。 5. IQI 雪隆区如何改变我们的房产体验? 随着房地产行业不断发展,客户对于买房、卖房和投资的需求也在不断变化。 过去,房地产中介主要依靠个人经验和传统方式服务客户,但现在,科技、数据分析以及数字化工具已经成为提升房地产体验的重要部分。 IQI 也不仅是房地产中介公司,更是房地产科技公司,在重视房地产专业知识的同时,也积极结合科技工具,帮助房地产中介提升服务效率,让客户在寻找、管理和交易房产的过程中,获得更顺畅的体验。 i. 科技赋能,让房地产服务更高效 在传统房地产交易中,客户可能需要通过不同渠道寻找房源、沟通需求和跟进交易进度。 而通过数字化工具,整个过程可以变得更加简单和透明。 IQI 通过 Atlas SuperApp 整合多项房地产工具,帮助房地产中介更有效地管理客户需求、跟进房源信息以及提升日常工作效率。 对于客户而言,这意味着: 更快速地获得房产资讯 更有效率地与房地产中介沟通 更清楚了解整个交易流程 而对于 IQI 的房地产中介而言,科技工具则帮助他们更好地服务客户,将更多时间投入在了解客户需求和提供专业建议上。 ii. AI 技术推动更智能的房地产服务 除了数字化平台,IQI 也积极探索人工智能(AI)在房地产行业中的应用。 通过 AI 工具,房地产中介可以更有效地: 分析市场趋势 了解客户需求 提供更精准的物业建议 优化营销策略 例如,在面对不同客户时,房地产中介可以结合市场数据和客户偏好,更快找到符合需求的房产选择,而不是单纯依靠过去的经验判断。 iii. 结合专业经验与科技,提供更完整的房地产体验 科技虽然能够提升效率,但房地产交易始终离不开人与人之间的信任和专业判断。 IQI 雪隆区的目标,是将房地产专业知识与科技优势结合,让房地产中介不仅拥有更强大的工具,也能够为客户提供更贴近实际需求的服务。 从寻找第一套房,到规划房地产投资,再到出售现有物业,IQI 希望通过更现代化的方式,让每一次房地产决定都变得更加简单、透明和有信心。 6. IQI 雪隆区是展开房地产事业的平台 对于很多想进入房地产行业的人来说,成为一名房地产中介,不只是寻找一份工作,而是希望建立一个能够长期发展的事业。 然而,房地产行业的成功,并不只是靠个人销售能力。 除了了解市场和客户需求,专业知识、沟通能力、营销技巧,以及持续学习的能力,都是成为优秀房地产顾问的重要因素。 IQI 相信,优秀的房地产人才需要一个能够支持成长的平台。 因此,IQI 不只是提供一个加入房地产行业的机会,也通过完善的培训体系、科技工具和团队支持,帮助房地产中介不断提升自己的专业能力。 i. 从新人到专业房地产顾问,提供成长支持 对于刚踏入房地产行业的新人来说,最大的挑战往往是不知道从哪里开始。 IQI 通过 IQI Academy、培训课程以及团队指导,帮助新加入的房地产中介学习: 房地产市场知识 客户沟通技巧 房地产营销方法 数字化工具应用 如何建立长期客户关系 透过系统化学习和经验分享,新人可以逐步建立信心,从初入行业慢慢成长为专业的房地产顾问。 ii. 科技与资源支持,帮助房地产事业持续发展 现代房地产行业已经不只是传统销售模式,优秀的房地产中介也需要懂得运用科技和数字工具提升效率。 就如上述所说,IQI 为房地产专业人士提供: 数字化房地产平台 营销工具支持 全球房地产网络资源 团队合作与交流机会 这些资源帮助房地产中介更有效地管理客户、拓展市场,并建立属于自己的房地产事业。 iii. 与志同道合的团队一起成长 房地产行业虽然充满机会,但个人成长过程中,有一个支持自己的团队同样重要。 在 IQI 雪隆区,房地产中介不仅可以获得专业资源,也能与来自不同背景的团队成员交流经验,共同学习和成长。 IQI 雪隆区并不是围绕单一领导者或单一团队品牌发展,而是逐渐建立成为一个由八个专业团队组成的房地产生态体系。 每个团队都由自己的创办人或资深领导者带领,并在 IQI 旗下拥有独特的团队文化、培训方式以及市场优势。 这些团队分别是: IQI Elite IQI United IQI iRealty IQI Dreammakerz IQI AG IQI ACE IQI Success One IQI CS 每个团队都是由选择以吉隆坡作为发展基地的领导者从零开始建立,并在这里逐步发展自己的团队社区与扩大房地产事业版图。 如今,这些专业团队共同组成 IQI 吉隆坡多元化且充满活力的房地产生态系统。 值得一提的是,这些团队的发展并不局限于吉隆坡和雪兰莪地区。 随着团队不断成长,旗下这八大专业团队也逐渐扩展至马来西亚不同州属,建立更广泛的房地产网络。 无论你来自柔佛、槟城、沙巴,或马来西亚其他地区,只要希望加入房地产行业并与专业团队一起成长,都可以参与 IQI 的事业平台,与全国各地的房地产专业人士共同发展。 如果你希望专注于雪隆区房地产市场发展,IQI 雪隆区将提供一个结合专业培训、团队支持与成长机会的平台。 加入 IQI 雪隆区,不只是成为一名房地产中介,更是开启一段持续学习、拓展事业,并创造长期价值的成长旅程。 7. 常见问题(FAQ): 1. IQI 雪隆区是值得信赖的房地产中介吗? IQI 雪隆区是 IQI 全球房地产网络的重要组成部分,结合本地房地产市场经验与国际资源,为客户提供专业的房地产服务。作为源自马来西亚的房地产网络,IQI 已发展至全球多个市场,拥有超过 65,000 名房地产专业人士,覆盖超过 35 个国家。通过专业团队、科技工具以及丰富的市场资源,IQI 雪隆区致力于帮助客户更安心地完成买房、卖房和房地产投资过程。 2. IQI 雪隆区可以帮助购买哪些类型的房产? IQI 雪隆区可以协助客户寻找不同类型的房地产,包括新推出的发展项目(New Launch)、二手房产(Subsale Property)、高端住宅、公寓、有地住宅以及商业房地产。无论您是首次购房者、希望升级居住环境的家庭,还是寻找投资机会的买家,IQI 房地产中介都会根据您的预算、需求和目标,提供更适合的房产建议。 3. IQI 雪隆区可以帮助外国人购买马来西亚房产吗? 可以。IQI 雪隆区拥有服务国际客户的经验,能够协助外国买家了解马来西亚房地产市场、购房流程以及相关注意事项。从寻找适合的物业,到了解当地市场情况和交易流程,IQI 团队可以为海外买家提供更全面的支持,帮助他们更顺利地探索马来西亚房地产机会。 4. IQI 雪隆区可以帮助出售我的房产吗? 可以。IQI 雪隆区团队能够协助业主完成整个房地产出售过程,包括分析当前市场情况、评估合理售价、制定物业推广策略、寻找潜在买家,以及协助价格谈判和交易流程。通过 IQI 的房地产网络和数字化工具,团队可以帮助业主提升物业曝光度,并更有效地寻找合适买家。 5. 如何加入 IQI 雪隆区成为房地产中介? 加入 IQI 雪隆区,你不只是成为一名房地产中介,更是进入一个拥有培训、团队支持和科技工具的房地产事业平台。IQI 提供房地产知识培训、专业技能提升课程、团队指导与经验分享,以及数字化工具支持,帮助新人逐步建立专业能力。无论是刚踏入房地产行业的新手,还是希望进一步拓展事业的专业人士,都可以通过 IQI 雪隆区建立长期发展的房地产事业。 对房地产事业有兴趣,想进一步了解更多?欢迎联系我们专业的房地产中介团队进一步聊聊,了解更多可能性! [custom_blog_recruit_form] 延伸阅读: 1. Z世代职业重置:年轻人成为房地产中介,以此实现收入与时间自由? 2. 在大马成为房地产中介(REN)需要具备什么核心技能? 3. 房地产中介佣金全解析:卖一套房,到底能赚多少?
Ready to get started?
Get in touch now.