

Team Leader (Subsales) ∙ Dreammakerz
Melissa Yap
PEA2758
About Melissa Yap
I advise clients on property strategy, investment decisions and asset disposal, with a strong focus on market analysis, due diligence, compliance and long-term outcomes. With seven years of experience in Malaysia’s property market, I have worked across residential, commercial, land and industrial as... I advise clients on property strategy, investment decisions and asset disposal, with a strong focus on market analysis, due diligence, compliance and long-term outcomes. With seven years of experience in Malaysia’s property market, I have worked across residential, commercial, land and industrial assets, supporting clients through transactions involving private treaty, sale by tender and strategic property advisory. My approach is grounded in market analysis, valuation considerations, regulatory awareness and due diligence. I work with clients across Kuantan, Kemaman and the wider East Coast, including property owners, buyers, investors and business clients.Increasingly, my work involves helping clients navigate:Property investment strategy and asset positioning__Market and valuation considerations___Holding strategy and exit planning___Commercial, industrial and land opportunities___Sale by tender and private treaty transactions___Due diligence and transaction considerations___I also lead the East Coast Tender Division, where I am involved in supporting and training new real estate negotiators in understanding the tender process and developing practical property skills.———— | Property decisions today should still make sense years from now. | __________ 我是 Melissa,一名专注于房地产策略、投资决策与资产处置的房地产顾问。在马来西亚房地产行业拥有 7年的经验,我的业务领域涵盖 住宅、商业地产、土地及工业地产,并参与 私人协议出售(Private Treaty)、公开竞标(Sale by Tender)以及房地产策略咨询。我的工作方式,不只是协助客户“找房子”或“卖房子”,而是从市场分析、价值判断、监管与合规考量,以及尽职调查出发,帮助客户看清一项房地产决策背后的风险、机会与长期影响。我目前主要扎根于 Kuantan、Pahang,同时服务 Kemaman 及东海岸地区的买家、业主、投资者及企业客户。除了房地产交易,我目前也负责 IQI 东海岸 Tender Division,参与房地产竞标业务,并协助培训新一代房地产经纪人,让他们更系统地了解竞标流程、市场判断及实际房地产操作。———— | 好的房地产决定,不只是今天正确,而是几年后回头看,依然合理。|
7 years at IQI
97 transactions
12 properties on sale
6 properties on rent

Melissa Yap's Service Locations
Melissa Yap's Service Locations
My Listings

Kuantan Bukit Gambang Residence City
Jalan Warisan 3, Kampung Pohoi, 26300 Gambang, Pahang
$ 136,460
Listed on October 16, 2025

D'embassy
D'Embassy Residence Suites
$ 985 /month
Listed on October 14, 2024

Mahkota Valley Suites
Jalan IM 9/3, Bandar Indera Mahkota
$ 317 /month
Listed on April 13, 2026

D'Embassy Suites
Bukit pelindung 76
$ 1,266 /month
Listed on September 15, 2023

D'embassy
D'Embassy Residence Suites
$ 136,460
Listed on June 20, 2026

Seri Kuantan
Jalan Seri Kuantan
$ 158,265
Listed on March 14, 2023

hulu jabur
Jalan Jabor Lama
$ 351,700
Listed on December 1, 2025

Windmill Upon Hills
Jalan Permai, Genting Permai Avenue
$ 182,884
Listed on April 2, 2026

ALAM PERDANA
LORONG IM 12, ALAM PERDANA, IM 12
$ 563 /month
Listed on October 15, 2024

PERUMAHAN ANAK AIR
LORONG ANAK AIR BARU 2,PERUMAHAN ANAK AIR, 26060
$ 147,714
Listed on September 30, 2026
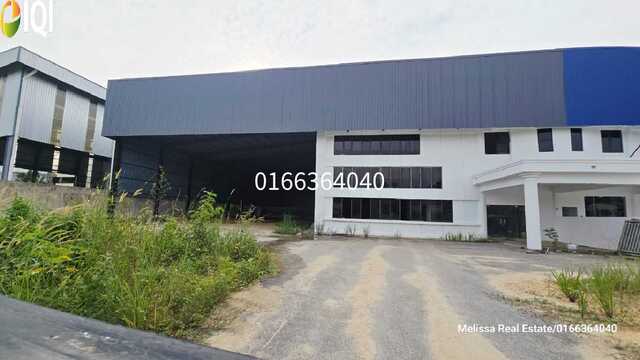
Jalan MEC Highway Gambang
1-storey Factory
$ 1,371,630
Listed on June 22, 2026

Imperium Residence Kuantan Waterfront Resort City
Tanjung Lumpur, Kuantan, Pahang
$ 126,612
Listed on July 31, 2020

Timurbay Seafront Residence
Jalan Kuantan – Kemaman, Sungai Karang
$ 193,435
Listed on December 16, 2025

Bandar MEC Gambang Kuantan
105 Jalan MEC 1, Bandar MEC, Gambang Kuantan, 26300, Gambang, Pahang, 26300
$ 6,682 /month
Listed on April 14, 2026

Persiaran Bandar Gambang
Persiaran Bandar Gambang, Perdana 3, 26300 Gambang, Pahang
$ 16,178,200
Listed on June 22, 2026

Residensi Prima Mahkota Jaya 2
Mahkota Jaya 2, Gambang
$ 87,222 /month
Listed on April 14, 2026

IMPERIUM RESIDENCE, KUANTAN WATERFRONT
JALAN TANJUNG LUMPUR, IMPERIUM RESIDENCE, KUANTAN WATERFRONT
$ 219,813
Listed on August 25, 2023

Sungai Marong
Bentong Pahang
$ 334,115
Listed on October 2, 2024
Our newly launched projects
Discover the real estate properties in and around Kuantan, Malaysia. Buy apartment units, landed houses, bungalows, commercial office space, shop lots, and sub-sales with 100% confidence at IQI Global.
 Located in Kubang Semang
Northern TechValley @BKE
Mukim 14, Kubang Semang, 14400 Seberang Perai, Penang, Malaysia
Starting from $ 5,098,074
Listed on January 23, 2026
 Varied built-up sizes
Taman IKS Bukit Minyak
Jalan IKS Bukit Minyak Utama, Taman IKS Bukit Minyak, 14100 Simpang Ampat, Penang, Malaysia.
Starting from $ 423,376
Listed on January 23, 2026
 Industrial project type
Regalway Industrial Hub (Industrial)
Regalway Industrial Hub, Off Jalan Bukit Panchor, Bukit Panchor, 14100 Simpang Ampat, Penang, Malaysia.
Starting from $ 1,763,776
Listed on January 23, 2026
 Spacious land area
Taman Jasa Ria (Garden Villa)
Jalan Permatang Pasir, Taman Jasa Ria, 14000 Bukit Mertajam, Penang, Malaysia
Starting from $ 393,482
Listed on January 23, 2026
 Located in Bukit Mertajam
Taman Jasa Intan (Garden Superlink)
Jalan Jasa Intan, Taman Jasa Intan, 14000 Bukit Mertajam, Penang, Malaysia
Starting from $ 287,691
Listed on January 23, 2026
 Large land area
Taman Fajar Permai (Sunrise Terrace)
Jalan Fajar, Taman Fajar Permai, 14300 Nibong Tebal, Penang, Malaysia.
Starting from $ 193,435
Listed on January 23, 2026
Mortgage Calculator
Calculate your estimated month repayment and plan your monthly expenses well.
The mortgage calculator is intended for reference only. Actual amount may vary.
Monthly Payment
Send me the mortgage calculator result

Home Loan Eligibility Calculator
Calculate your potential loan amount and assess your home buying affordability.

Rental Yield
Calculate the potential rental yield and evaluate a property's investment performance.

Down Payment Saving Plan
Create a structured savings plan and determine how much to save monthly for your down payment plan.

Malaysian Property Transaction Fees Calculator
Estimate the total transaction fees and budget accurately for your Malaysian property purchase.
IQI blog & news
Articles specifically curated for your daily digest of local and global real estate news.

Housing Weakness Spreads Across Capital Cities Australia’s housing slowdown intensified through winter, with home values declining across 93% of capital-city suburbs, more than double the 45.8% recorded during autumn. Darwin was the only capital city to avoid a decline over the three-month period. Cotality’s national Home Value Index fell 0.9% in August, marking the fifth consecutive monthly decline. National home values are now 3.6% below the March market peak. Sydney remained the weakest capital-city market, falling 1.4% in August and sitting 7.1% below its February peak. Melbourne and Canberra each declined 1.1%, while Brisbane fell 1.0%. Adelaide and Perth both recorded a 0.8% decrease, highlighting the increasingly broad nature of the downturn. Slower Sales Strengthen Buyer Conditions High borrowing costs, tighter lending conditions and affordability pressures continue to weigh on demand. Quarterly home sales were 15.5% lower than a year earlier and 11.5% below the five-year average, with Brisbane, Perth and Sydney recording annual declines of more than 20%. At the same time, capital-city listings were 24% higher than a year ago. Longer selling periods, greater vendor discounts and softer auction-clearance rates are creating more buyer-favourable conditions, although weak confidence continues to limit transaction activity. Outlook Australia’s housing market is likely to remain selective and buyer-driven in the near term. Elevated stock levels and softer demand may continue to pressure values, while buyers with strong financing positions could benefit from greater choice and improved negotiating power. For investors and homeowners, markets such as Perth may still present opportunities for those taking a long-term view. The contents of this article were contributed by Lily Chong, Head of IQI Australia. Download to see insights from other country marketsDownload
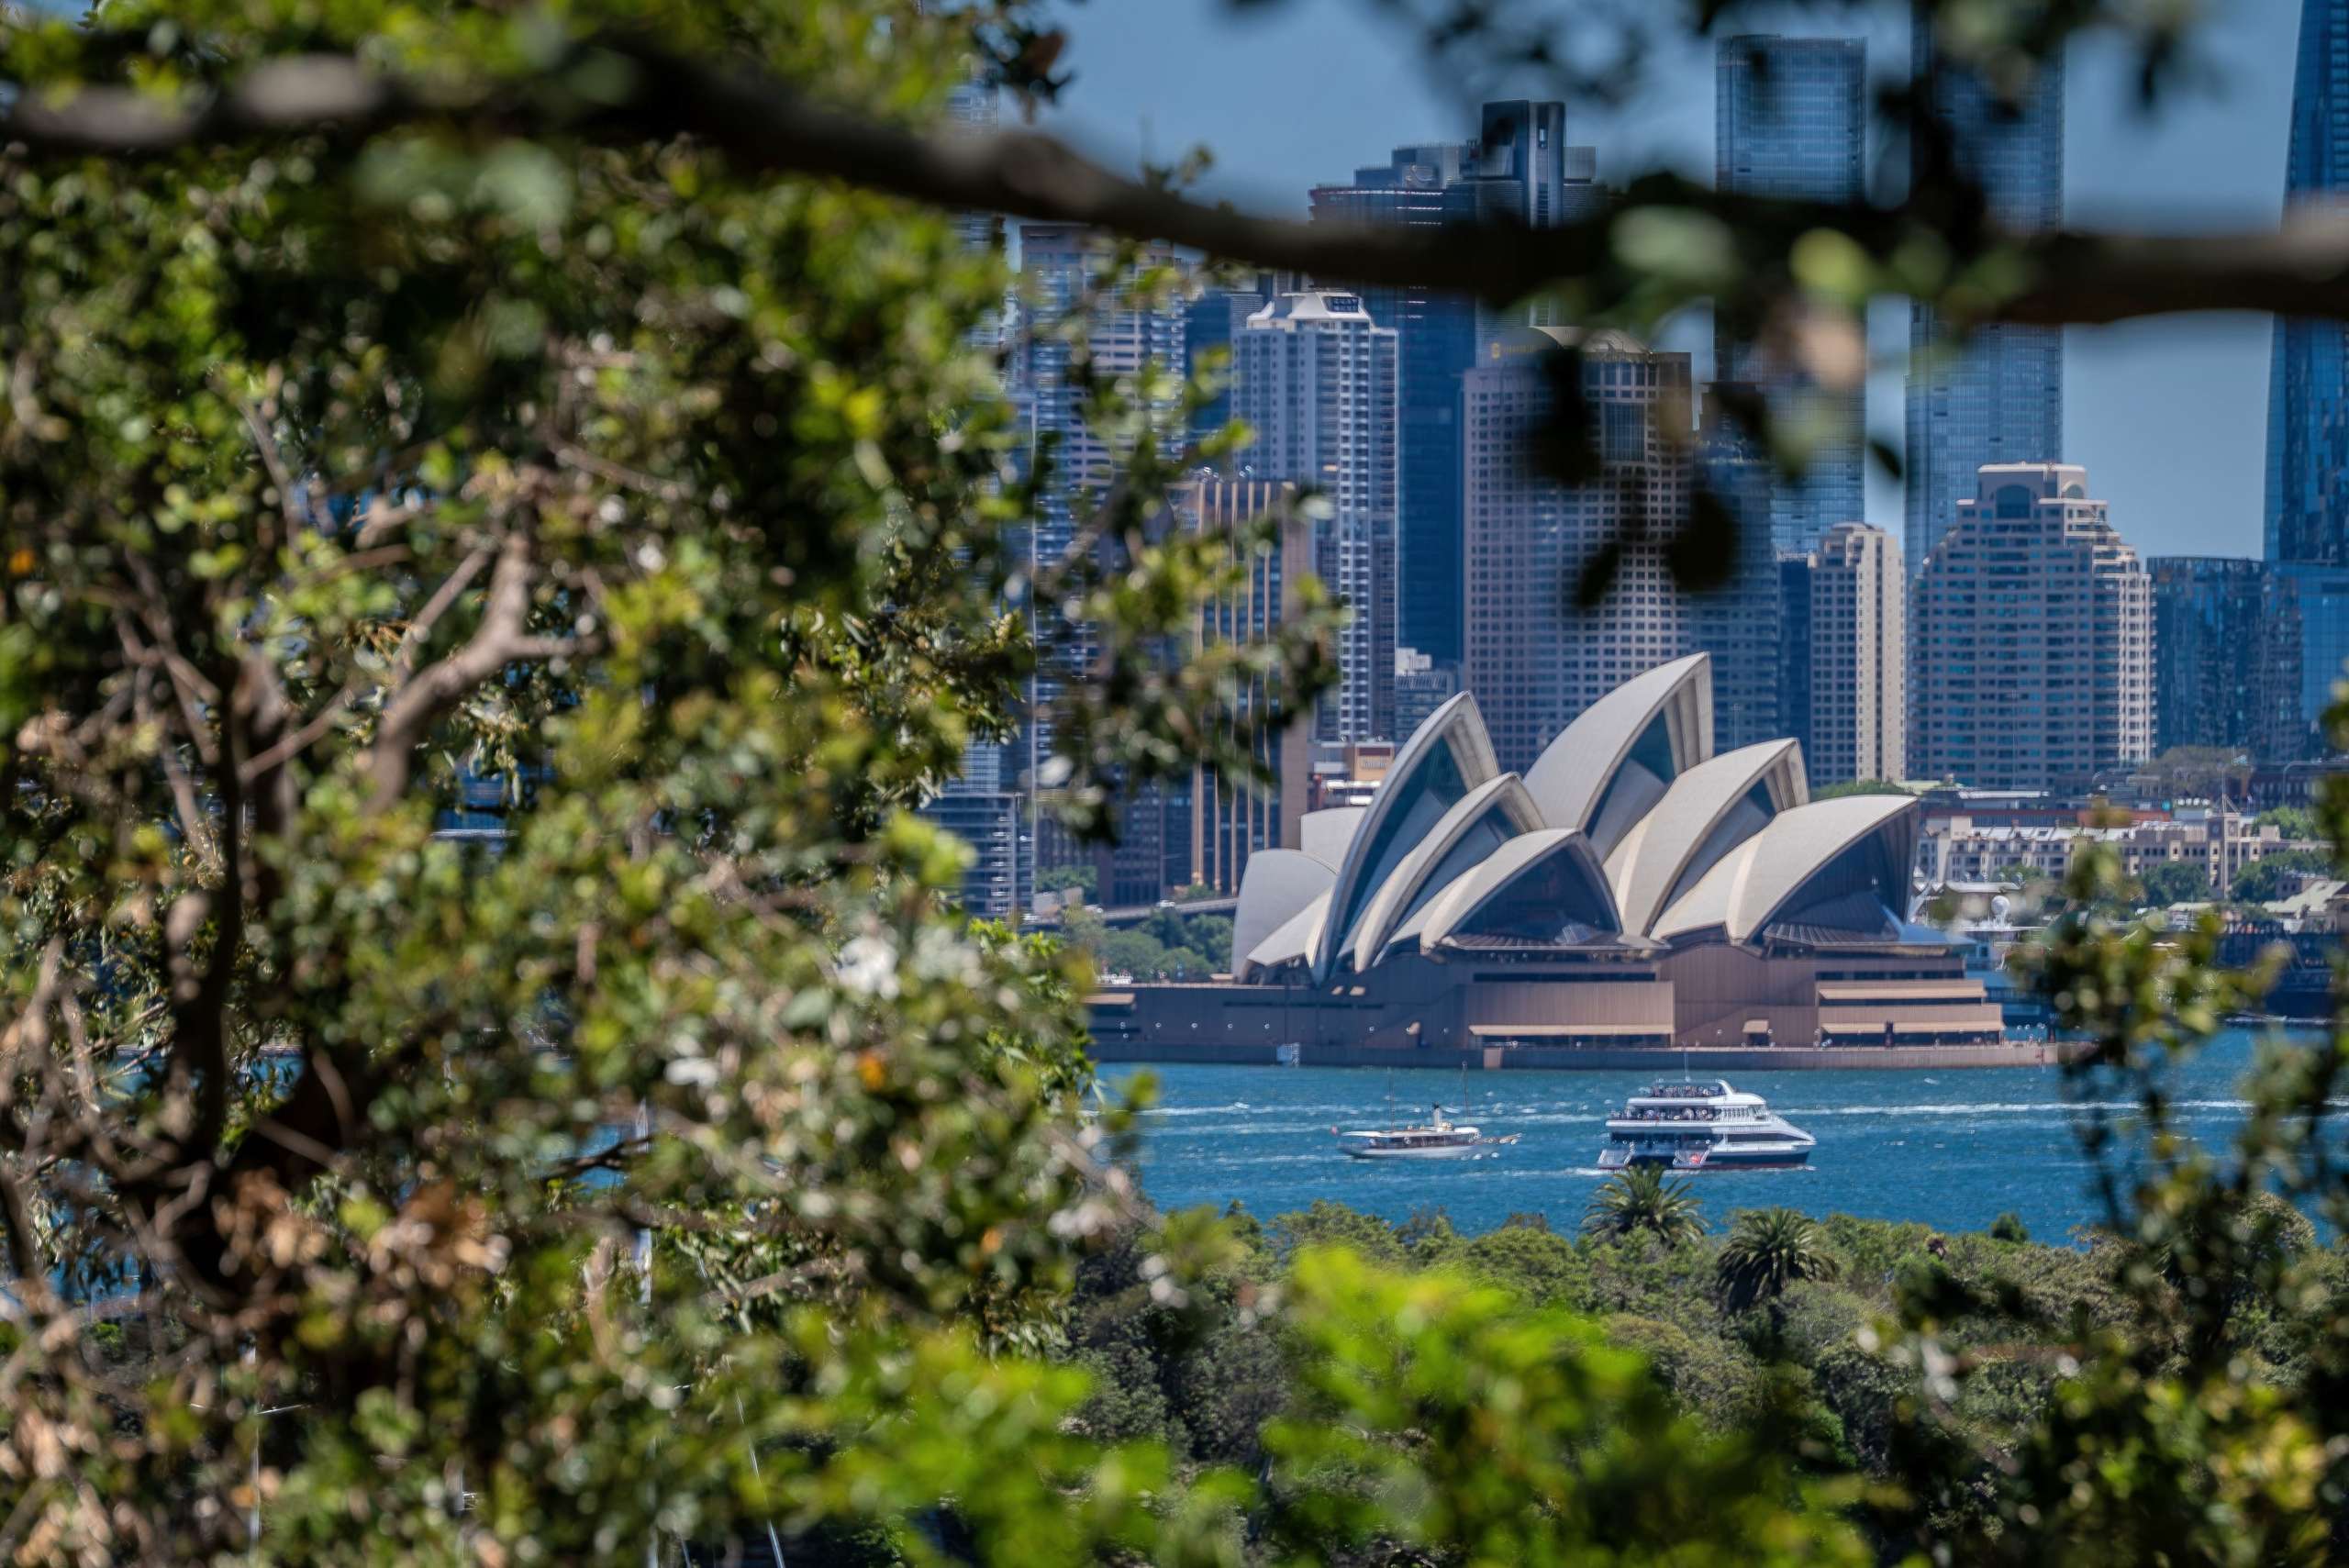
Australia’s Housing Downturn Spreads Australia’s housing market lost further momentum in July, with Cotality’s national Home Value Index falling 0.7%, its largest monthly decline in more than three years. Sydney and Melbourne remained the weakest major markets, with home values falling 1.4% and 1.2% respectively during the month. However, the slowdown is becoming more widespread. Brisbane declined 0.6%, while Adelaide fell 0.2%, with both cities recording two consecutive months of falling values following historical revisions. Perth showed a small 0.1% monthly increase, although its June result was revised to a 0.5% decline, signalling how quickly conditions have shifted from the city’s earlier growth phase. Premium Homes Feel More Pressure The correction has been particularly noticeable at the higher end of the market. Values in the upper quartile fell 3.2% over the three months to July, compared with a 0.3% gain among lower-value properties. Several factors are weighing on demand, including affordability constraints, three cash-rate increases and weak consumer confidence. At the same time, advertised housing supply has increased. Capital-city auction clearance rates have remained below 50%, suggesting buyers and sellers are still struggling to agree on pricing. Outlook Australia’s housing market is likely to remain price-sensitive and uneven across cities and property segments in the near term. With higher-value homes experiencing the greatest pressure, buyers may gain greater negotiating power in selected markets. For homeowners and investors, conditions will require closer attention to local demand, pricing and affordability rather than relying on broader national trends. The contents of this article were contributed by Lily Chong, Head of IQI Australia. Download to see insights from other country marketsDownload
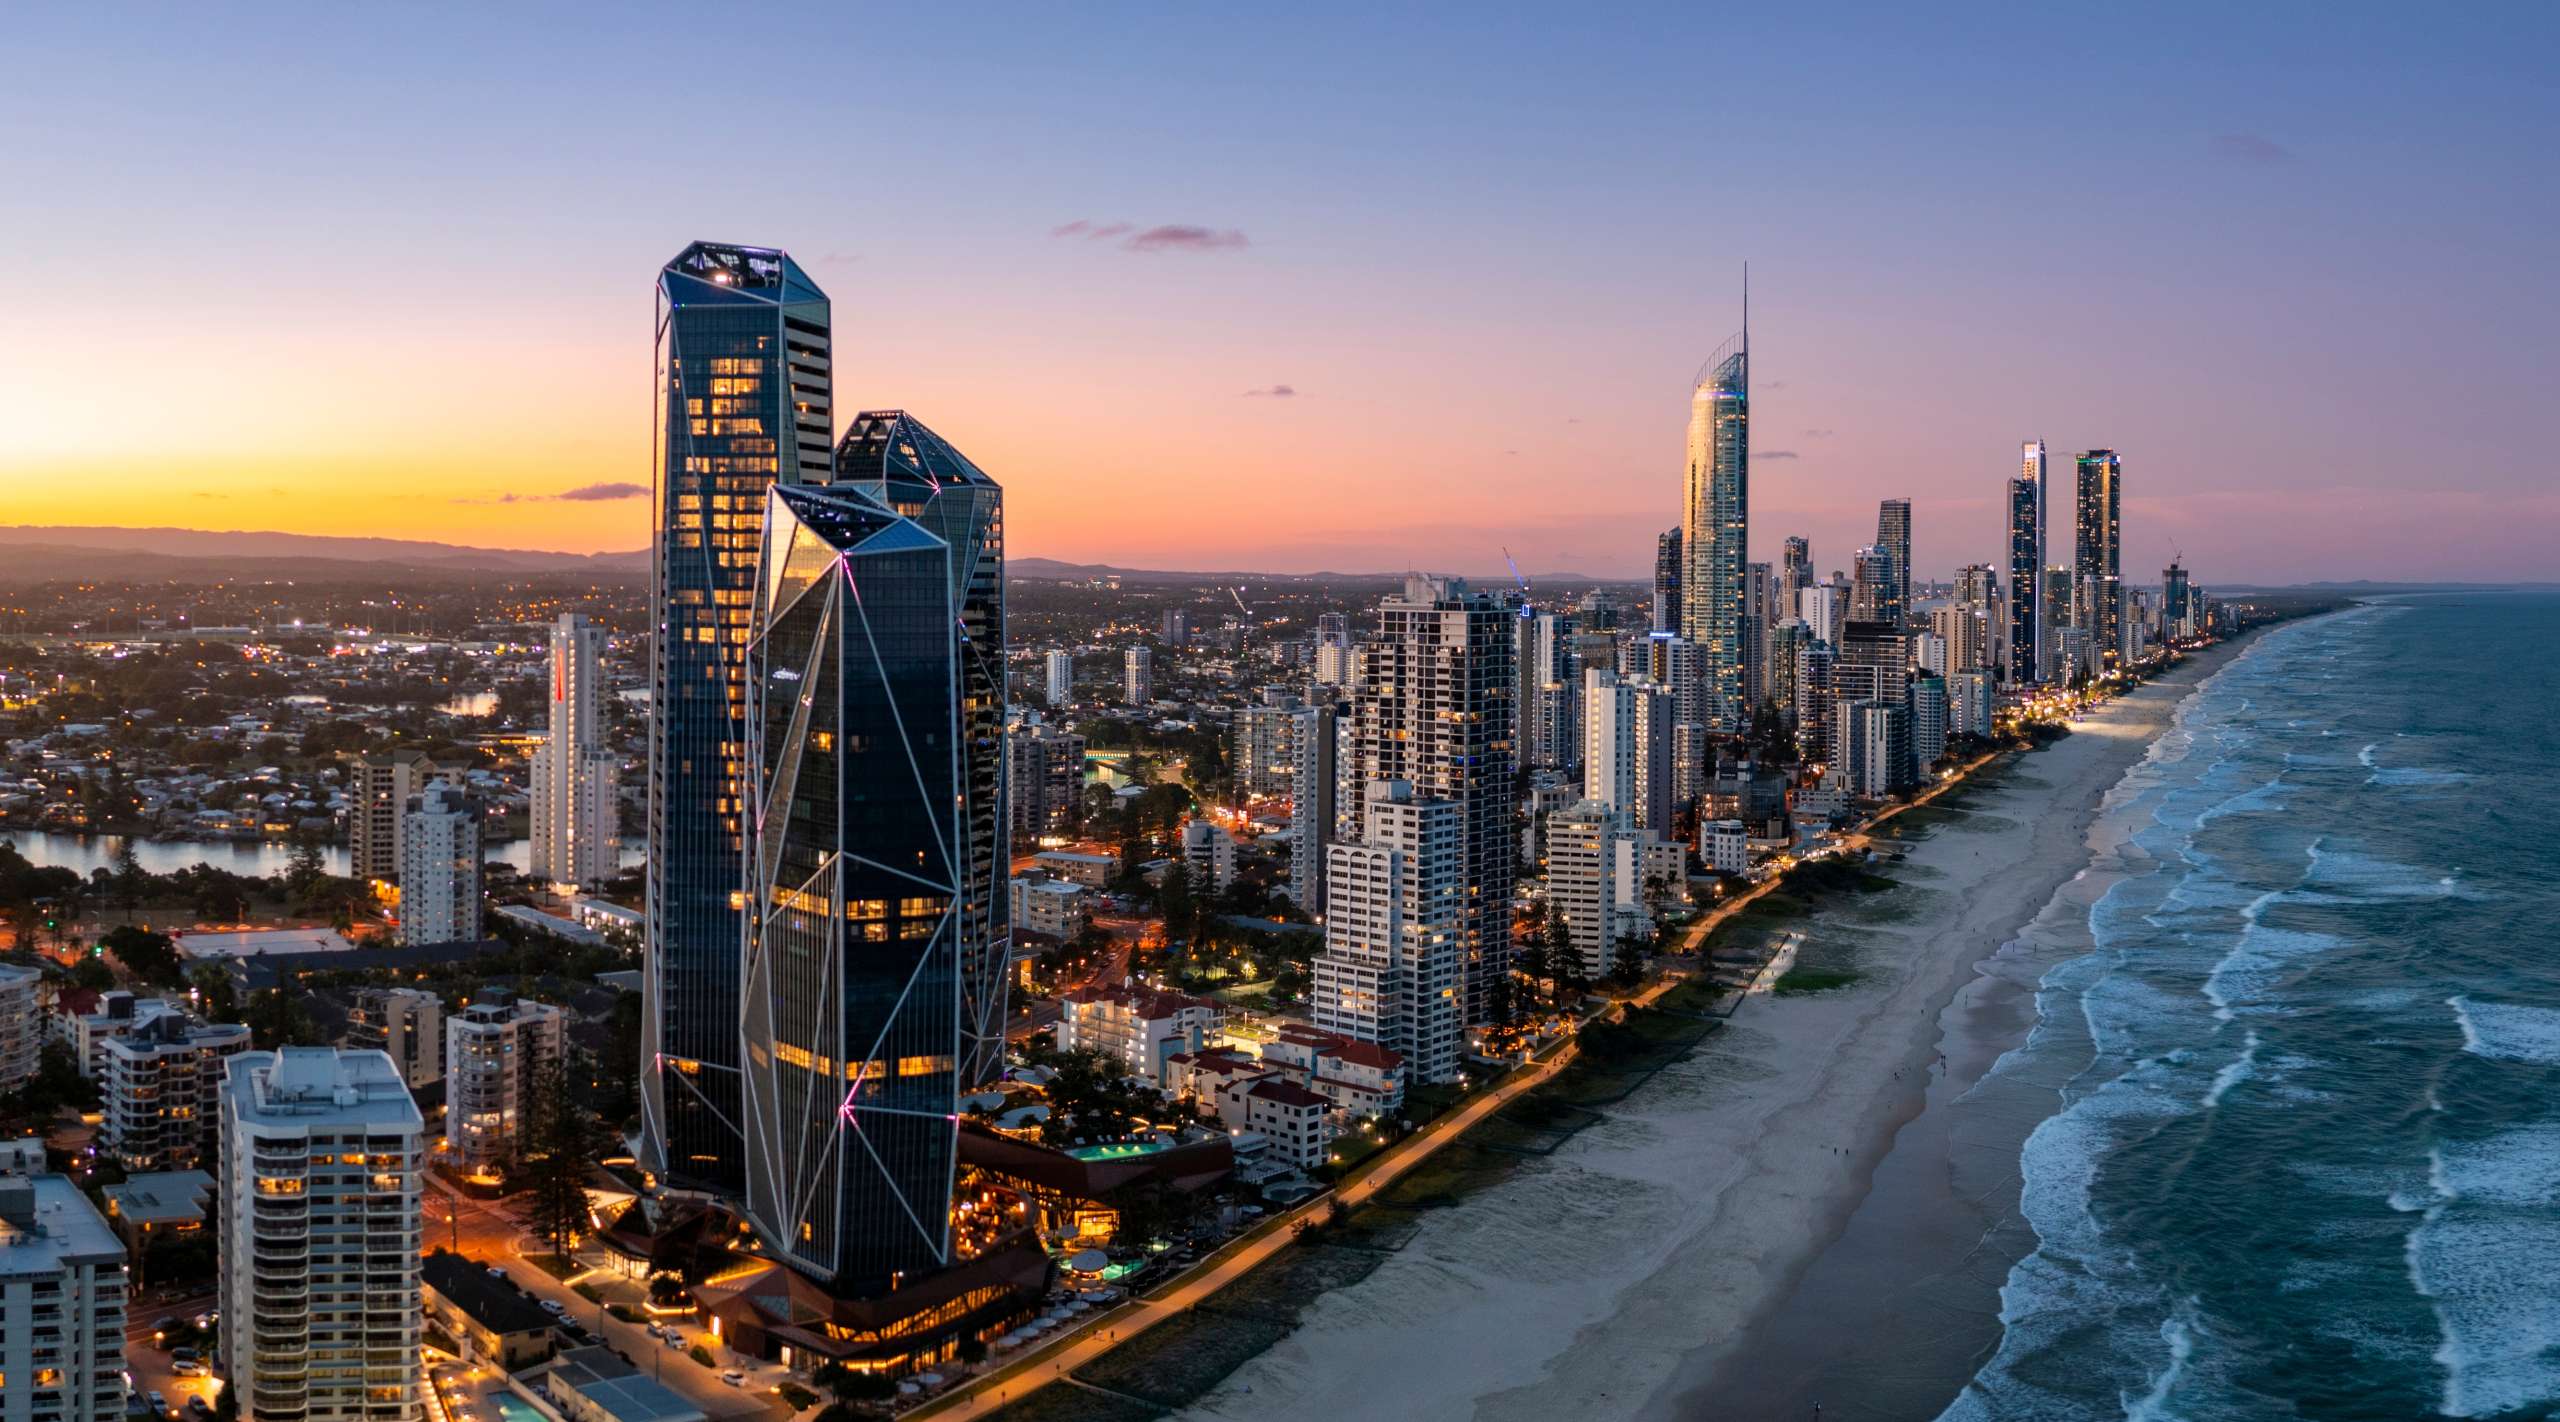
Australia’s Housing Market Enters a Cooling Phase Australia’s housing market shifted in June 2026, with the national Home Value Index falling 0.4% month-on-month. This was the largest monthly decline recorded since December 2022. Sydney experienced the sharpest correction, with dwelling values falling 1.2%, followed by Melbourne at 1.0% and Canberra at 0.6%. Adelaide remained unchanged, while Brisbane and Perth continued to grow by 0.3% and 0.7%respectively. Over the June quarter, national dwelling values declined 0.7%, while combined capital city values fell 1.3%. The slowdown was mainly driven by weaker buyer demand and growing affordability pressures. Market Conditions Become More Buyer-Friendly Higher interest rates, cost-of-living pressures, cautious buyer sentiment and recent property tax changes have contributed to softer market conditions. Auction clearance rates across the combined capital cities have remained below 50% since late May. Capital city sales volumes were also estimated to be 16.2% lower year-on-year. Meanwhile, advertised listings increased by almost 11% compared with the previous year. This has given buyers more options, reduced urgency and placed greater pressure on sellers to set realistic asking prices. Despite the national slowdown, market performance remains uneven. Perth recorded the strongest annual growth among the major capital cities at 23.9%, while Brisbane increased 17.4%, highlighting continued demand in selected markets. Outlook Australia’s housing market is likely to remain more balanced and selective in the coming months. Buyers may benefit from wider choice and improved negotiating power, while sellers will need to align pricing expectations with changing demand. Markets with stronger population growth, affordability and supply fundamentals, particularly Perth, may remain more resilient than Sydney and Melbourne. Download to see insights from other country marketsDownload

Australia Housing Market Slows in May 2026 Australia’s housing market showed clearer signs of slowing in May, with Cotality’s national Home Value Index remaining flat. The data suggests that momentum is easing across most regions as buyers face affordability pressure, tighter borrowing capacity and broader demand-side challenges. The slowdown was most visible in Sydney and Melbourne, where dwelling values fell by 0.9% and 0.8% respectively over the month. Both cities are now below their recent market peaks recorded in November last year. The ACT also softened slightly, with values down 0.2%. However, the market remains highly uneven. Perth and Darwin recorded the strongest monthly gains at 1.5%, followed by Brisbane and Hobart at 0.9%, and Adelaide at 0.5%. Cotality Research Director Tim Lawless noted that Australia’s housing market is moving at different speeds. Over the past five years, Perth home values surged 91.4%, while Melbourne rose only 3.3%, highlighting the gap between stronger and weaker city markets. Sales activity is also cooling. National home sales over the past three months were estimated to be 2.2% lower year-on-year and 4.1% below the five-year average. Sydney and Melbourne recorded the sharpest annual falls in sales, down 17.0% and 14.2% respectively. Outlook Looking ahead, Australia’s property market is expected to remain selective rather than broadly weak. Cities with stronger population growth, tighter supply and better affordability may continue to outperform. For buyers, rising listings and softer auction clearance rates could create more room to negotiate. For sellers, realistic pricing will be increasingly important as market conditions become more balanced. Juwai IQI Newsletter July 2026 RDownload
Ready to get started?
Get in touch now.
