

Negotiator ∙ United
Lim Boon Chin

Negotiator ∙ United
Lim Boon Chin

About Lim Boon Chin
Leveraging market knowledge and negotiation skills to deliver exceptional results. Your real estate success is my priority. Ready to make your real estate dreams a reality? Let's chat. Your dream home awaits.
1 year at IQI
12 transactions
22 properties on sale
26 properties on rent
Contact Lim Boon Chin
Lim Boon Chin Social Links
No social links available.
Lim Boon Chin's Service Locations
Lim Boon Chin's Service Locations
My Listings

Pangsapuri Orchid, Taman Puchong Prima
Taman Puchong Prima, 47100, Selangor
$ 82,224
Listed on May 28, 2025

Riana South
Persiaran Alam Damai, 56000, Kuala Lumpur
$ 232,968
Listed on May 28, 2025

The Havre, Bukit Jalil
Lebuhraya Bukit Jalil
$ 891 /month
Listed on June 20, 2025

Legasi Kampung Baru
Jalan Raja Muda Musa, Kampung Baru
$ 1,370 /month
Listed on June 9, 2025

M Arisa
Jalan Sentul Pasar
$ 634 /month
Listed on June 13, 2025

Fera Residence @ The Quartz
Seksyen 10 Wangsa Maju
$ 788 /month
Listed on June 14, 2025
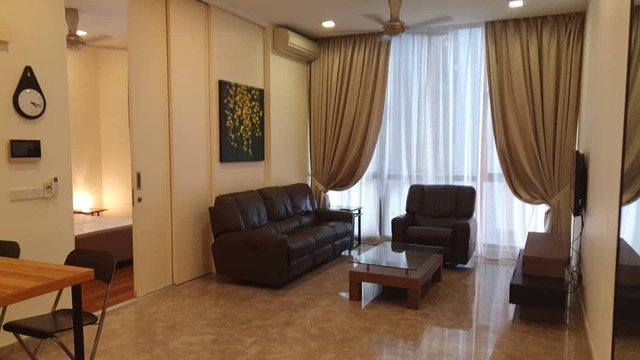
Laman Ceylon
Jalan Ceylon, Bukit Bintang
$ 231,255
Listed on June 5, 2025

Bangsar Hill Park
Lorong Maarof
$ 1,336 /month
Listed on June 19, 2025

Indah Villa
Jalan PJS 11/12, Bandar Sunway
$ 857 /month
Listed on June 11, 2025

Quill Residences
Jalan Sultan Ismail, 50300, Kuala Lumpur
$ 411,120
Listed on May 28, 2025

Core Residence @ TRX
Jalan Tun Razak
$ 1,696 /month
Listed on June 10, 2025

Tun Hussein Onn, Cheras
Tun Hussein Onn, Cheras
$ 256,950
Listed on June 13, 2025

Riana Green East
Jalan 34/26,, 53300, Kuala Lumpur
$ 318,618
Listed on May 6, 2025

Taragon Puteri Bintang
Jalan Changkat Thambi Dollah
$ 301,488
Listed on May 28, 2025

Puncak Damansara
Jalan Teratai PJU 6, 47400, Selangor
$ 514 /month
Listed on May 28, 2025

Prima Setapak
Jalan Prima Setapak 7
$ 514 /month
Listed on June 18, 2025

Kiara Residences 2 (Residensi Kiara Jalil 2)
Jalan 3/155A, Bukit OUG
$ 256,950
Listed on June 17, 2025

Taman Bukit Anggerik
Taman Bukit Anggerik, Cheras
$ 685 /month
Listed on May 28, 2025

Legasi Kampung Baru
Jalan Raja Muda Musa, Kampung Baru, 50300, Kuala Lumpur
$ 274,080
Listed on May 28, 2025
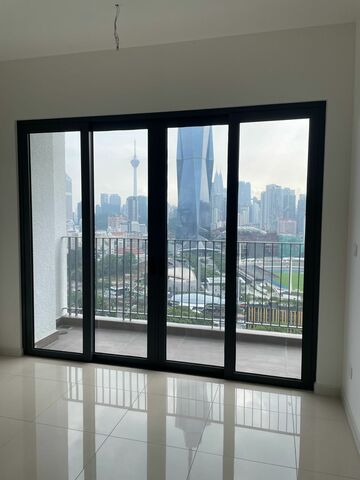
Sunway Belfield Residence
Jalan Belfield, 50150, Kuala Lumpur
$ 1,370 /month
Listed on May 5, 2025

Sri Ledang
Jalan 4/27E, Seksyen 10, Wangsa Maju
$ 143,892
Listed on June 17, 2025

Cubic Botanical
Jalan Sentral 3
$ 256,950
Listed on May 28, 2025

Taman Continental (Continental Park)
Jalan Batalong 2
$ 208,986
Listed on June 7, 2025
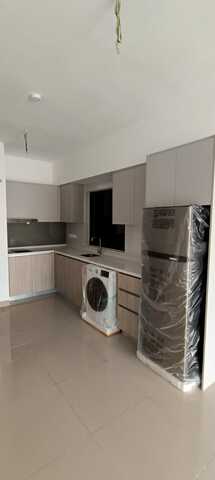
M Arisa
Jalan Sentul Pasar
$ 685 /month
Listed on June 22, 2025

Lexa Residence @ The Quartz
Jalan 34/26
$ 150,744
Listed on June 19, 2025

Mont Kiara Aman
Jalan Kiara 2
$ 582,420
Listed on June 14, 2025

Aria Luxury Residence
Jalan Tun Razak, Kuala Lumpur, 50450, Kuala Lumpur
$ 2,038 /month
Listed on May 6, 2025

Sky Suites @ KLCC
Jalan P. Ramlee
$ 1,439 /month
Listed on June 20, 2025

Southbank Residence
Jalan Klang Lama
$ 822 /month
Listed on June 20, 2025
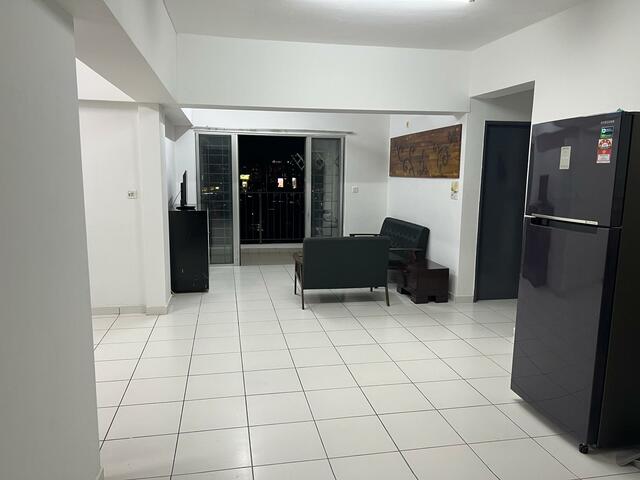
Axis Residences @ Axis Pandan
Jalan Cempaka, Ampang
$ 188,430
Listed on June 22, 2025

Razak City Residences
Lebuhraya Sungai Besi BESRAYA
$ 169,587
Listed on June 10, 2025

Idaman Residence
Jalan Law Yew Swee, 50250, Kuala Lumpur
$ 445,380
Listed on May 5, 2025

Laman Ceylon
Jalan Ceylon, Bukit Bintang
$ 325,470
Listed on June 12, 2025

Razak City Residences
Lebuhraya Sungai Besi BESRAYA
$ 685 /month
Listed on June 9, 2025

Contessa, Bangsar
Jalan Kapas
$ 342,600
Listed on June 18, 2025

Paraiso Residence
Jalan Jalil 2, 57000, Kuala Lumpur
$ 857 /month
Listed on May 6, 2025

Altris Residence
Jln 34/26, Seksyen 10 Wangsa Maju
$ 1,199 /month
Listed on June 14, 2025
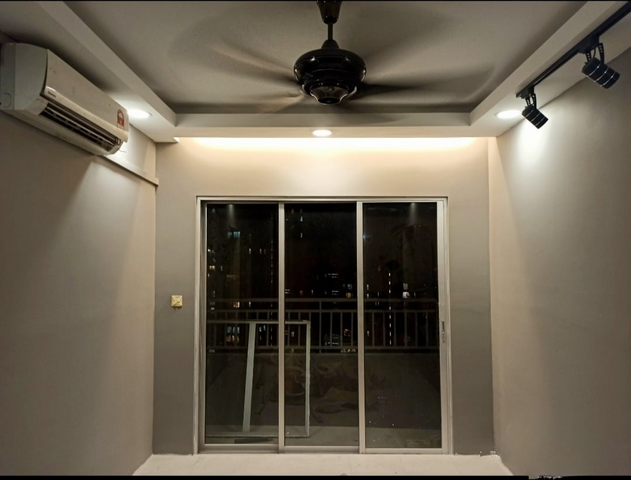
Residensi Wangsamas
Jalan Wangsa Delima, Wangsa Maju
$ 617 /month
Listed on June 21, 2025

Laman Ceylon
Jalan Ceylon, Bukit Bintang
$ 342,600
Listed on June 5, 2025

Saville @ Melawati
Jalan Kolam Air
$ 178,152
Listed on June 14, 2025

Villa Flora
Jalan Burhanuddin Helmi
$ 1,199 /month
Listed on June 10, 2025

Laman Ceylon
Jalan Ceylon, Bukit Bintang
$ 1,302 /month
Listed on June 12, 2025

Taman Melawati
Jalan Melawati , Taman Melawati, 53100 Gombak, Selangor
$ 942,150
Listed on May 28, 2025

Sentral Suites
Jalan Tun Sambanthan
$ 1,713 /month
Listed on June 10, 2025

Scarletz Suites
Jalan Yap Kwan Seng
$ 1,302 /month
Listed on June 16, 2025

Sentral Suites
Jalan Tun Sambanthan
$ 1,302 /month
Listed on June 11, 2025

Endah Promenade
Taman Sri Endah
$ 857 /month
Listed on June 8, 2025

Laman Ceylon
Jalan Ceylon, Bukit Bintang
$ 891 /month
Listed on June 6, 2025
Our newly launched projects
Discover the real estate properties in and around Kuala Lumpur, Malaysia. Buy apartment units, landed houses, bungalows, commercial office space, shop lots, and sub-sales with 100% confidence at IQI Global.
 Large land area
Northern TechValley @BKE
Mukim 14, Kubang Semang, 14400 Seberang Perai, Penang, Malaysia
Starting from $ 4,966,165
Listed on January 23, 2026
 Varied built-up sizes
Taman IKS Bukit Minyak
Jalan IKS Bukit Minyak Utama, Taman IKS Bukit Minyak, 14100 Simpang Ampat, Penang, Malaysia.
Starting from $ 412,422
Listed on January 23, 2026
 Located in Simpang Ampat
Regalway Industrial Hub (Industrial)
Regalway Industrial Hub, Off Jalan Bukit Panchor, Bukit Panchor, 14100 Simpang Ampat, Penang, Malaysia.
Starting from $ 1,718,139
Listed on January 23, 2026
 Spacious land area
Taman Jasa Ria (Garden Villa)
Jalan Permatang Pasir, Taman Jasa Ria, 14000 Bukit Mertajam, Penang, Malaysia
Starting from $ 383,301
Listed on January 23, 2026
 Larger built-up area
Taman Jasa Intan (Garden Superlink)
Jalan Jasa Intan, Taman Jasa Intan, 14000 Bukit Mertajam, Penang, Malaysia
Starting from $ 280,247
Listed on January 23, 2026
 Large land area
Taman Fajar Permai (Sunrise Terrace)
Jalan Fajar, Taman Fajar Permai, 14300 Nibong Tebal, Penang, Malaysia.
Starting from $ 188,430
Listed on January 23, 2026
Mortgage Calculator
Calculate your estimated month repayment and plan your monthly expenses well.
The mortgage calculator is intended for reference only. Actual amount may vary.
Monthly Payment
Send me the mortgage calculator result

Home Loan Eligibility Calculator
Calculate your potential loan amount and assess your home buying affordability.

Rental Yield
Calculate the potential rental yield and evaluate a property's investment performance.

Down Payment Saving Plan
Create a structured savings plan and determine how much to save monthly for your down payment plan.

Malaysian Property Transaction Fees Calculator
Estimate the total transaction fees and budget accurately for your Malaysian property purchase.
IQI blog & news
Articles specifically curated for your daily digest of local and global real estate news.
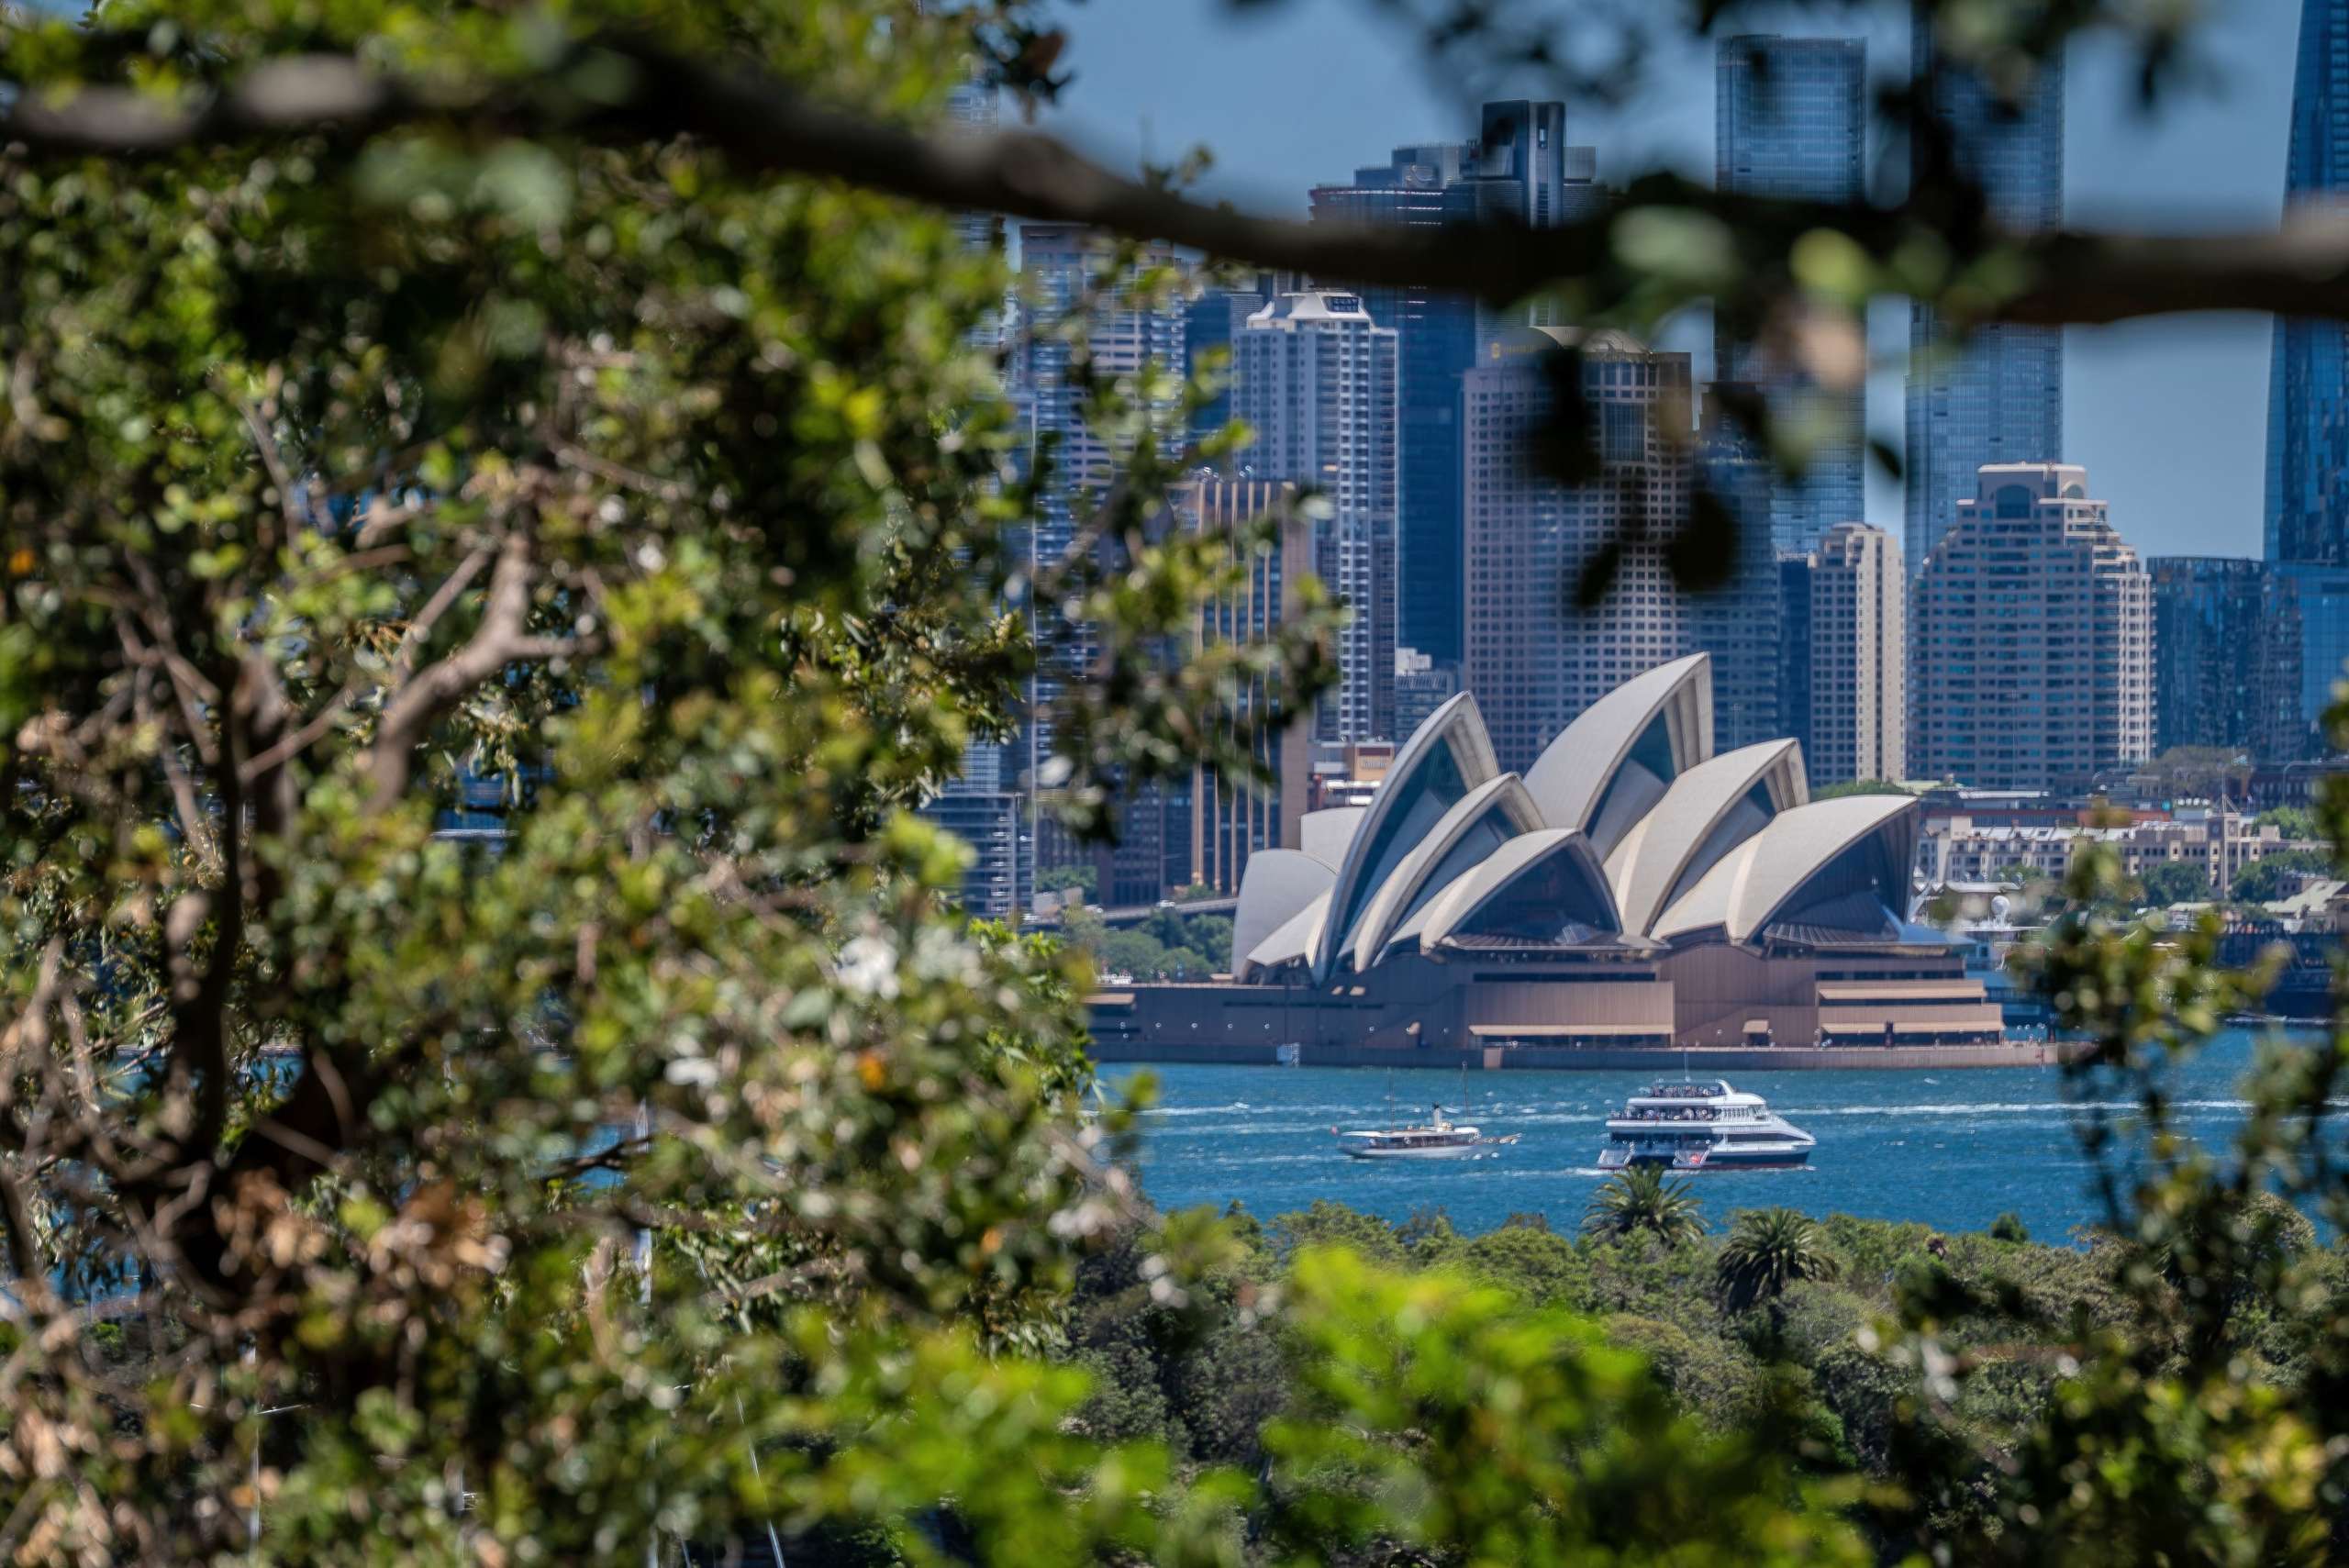
Australia’s Housing Downturn Spreads Australia’s housing market lost further momentum in July, with Cotality’s national Home Value Index falling 0.7%, its largest monthly decline in more than three years. Sydney and Melbourne remained the weakest major markets, with home values falling 1.4% and 1.2% respectively during the month. However, the slowdown is becoming more widespread. Brisbane declined 0.6%, while Adelaide fell 0.2%, with both cities recording two consecutive months of falling values following historical revisions. Perth showed a small 0.1% monthly increase, although its June result was revised to a 0.5% decline, signalling how quickly conditions have shifted from the city’s earlier growth phase. Premium Homes Feel More Pressure The correction has been particularly noticeable at the higher end of the market. Values in the upper quartile fell 3.2% over the three months to July, compared with a 0.3% gain among lower-value properties. Several factors are weighing on demand, including affordability constraints, three cash-rate increases and weak consumer confidence. At the same time, advertised housing supply has increased. Capital-city auction clearance rates have remained below 50%, suggesting buyers and sellers are still struggling to agree on pricing. Outlook Australia’s housing market is likely to remain price-sensitive and uneven across cities and property segments in the near term. With higher-value homes experiencing the greatest pressure, buyers may gain greater negotiating power in selected markets. For homeowners and investors, conditions will require closer attention to local demand, pricing and affordability rather than relying on broader national trends. The contents of this article were contributed by Lily Chong, Head of IQI Australia. Download to see insights from other country marketsDownload
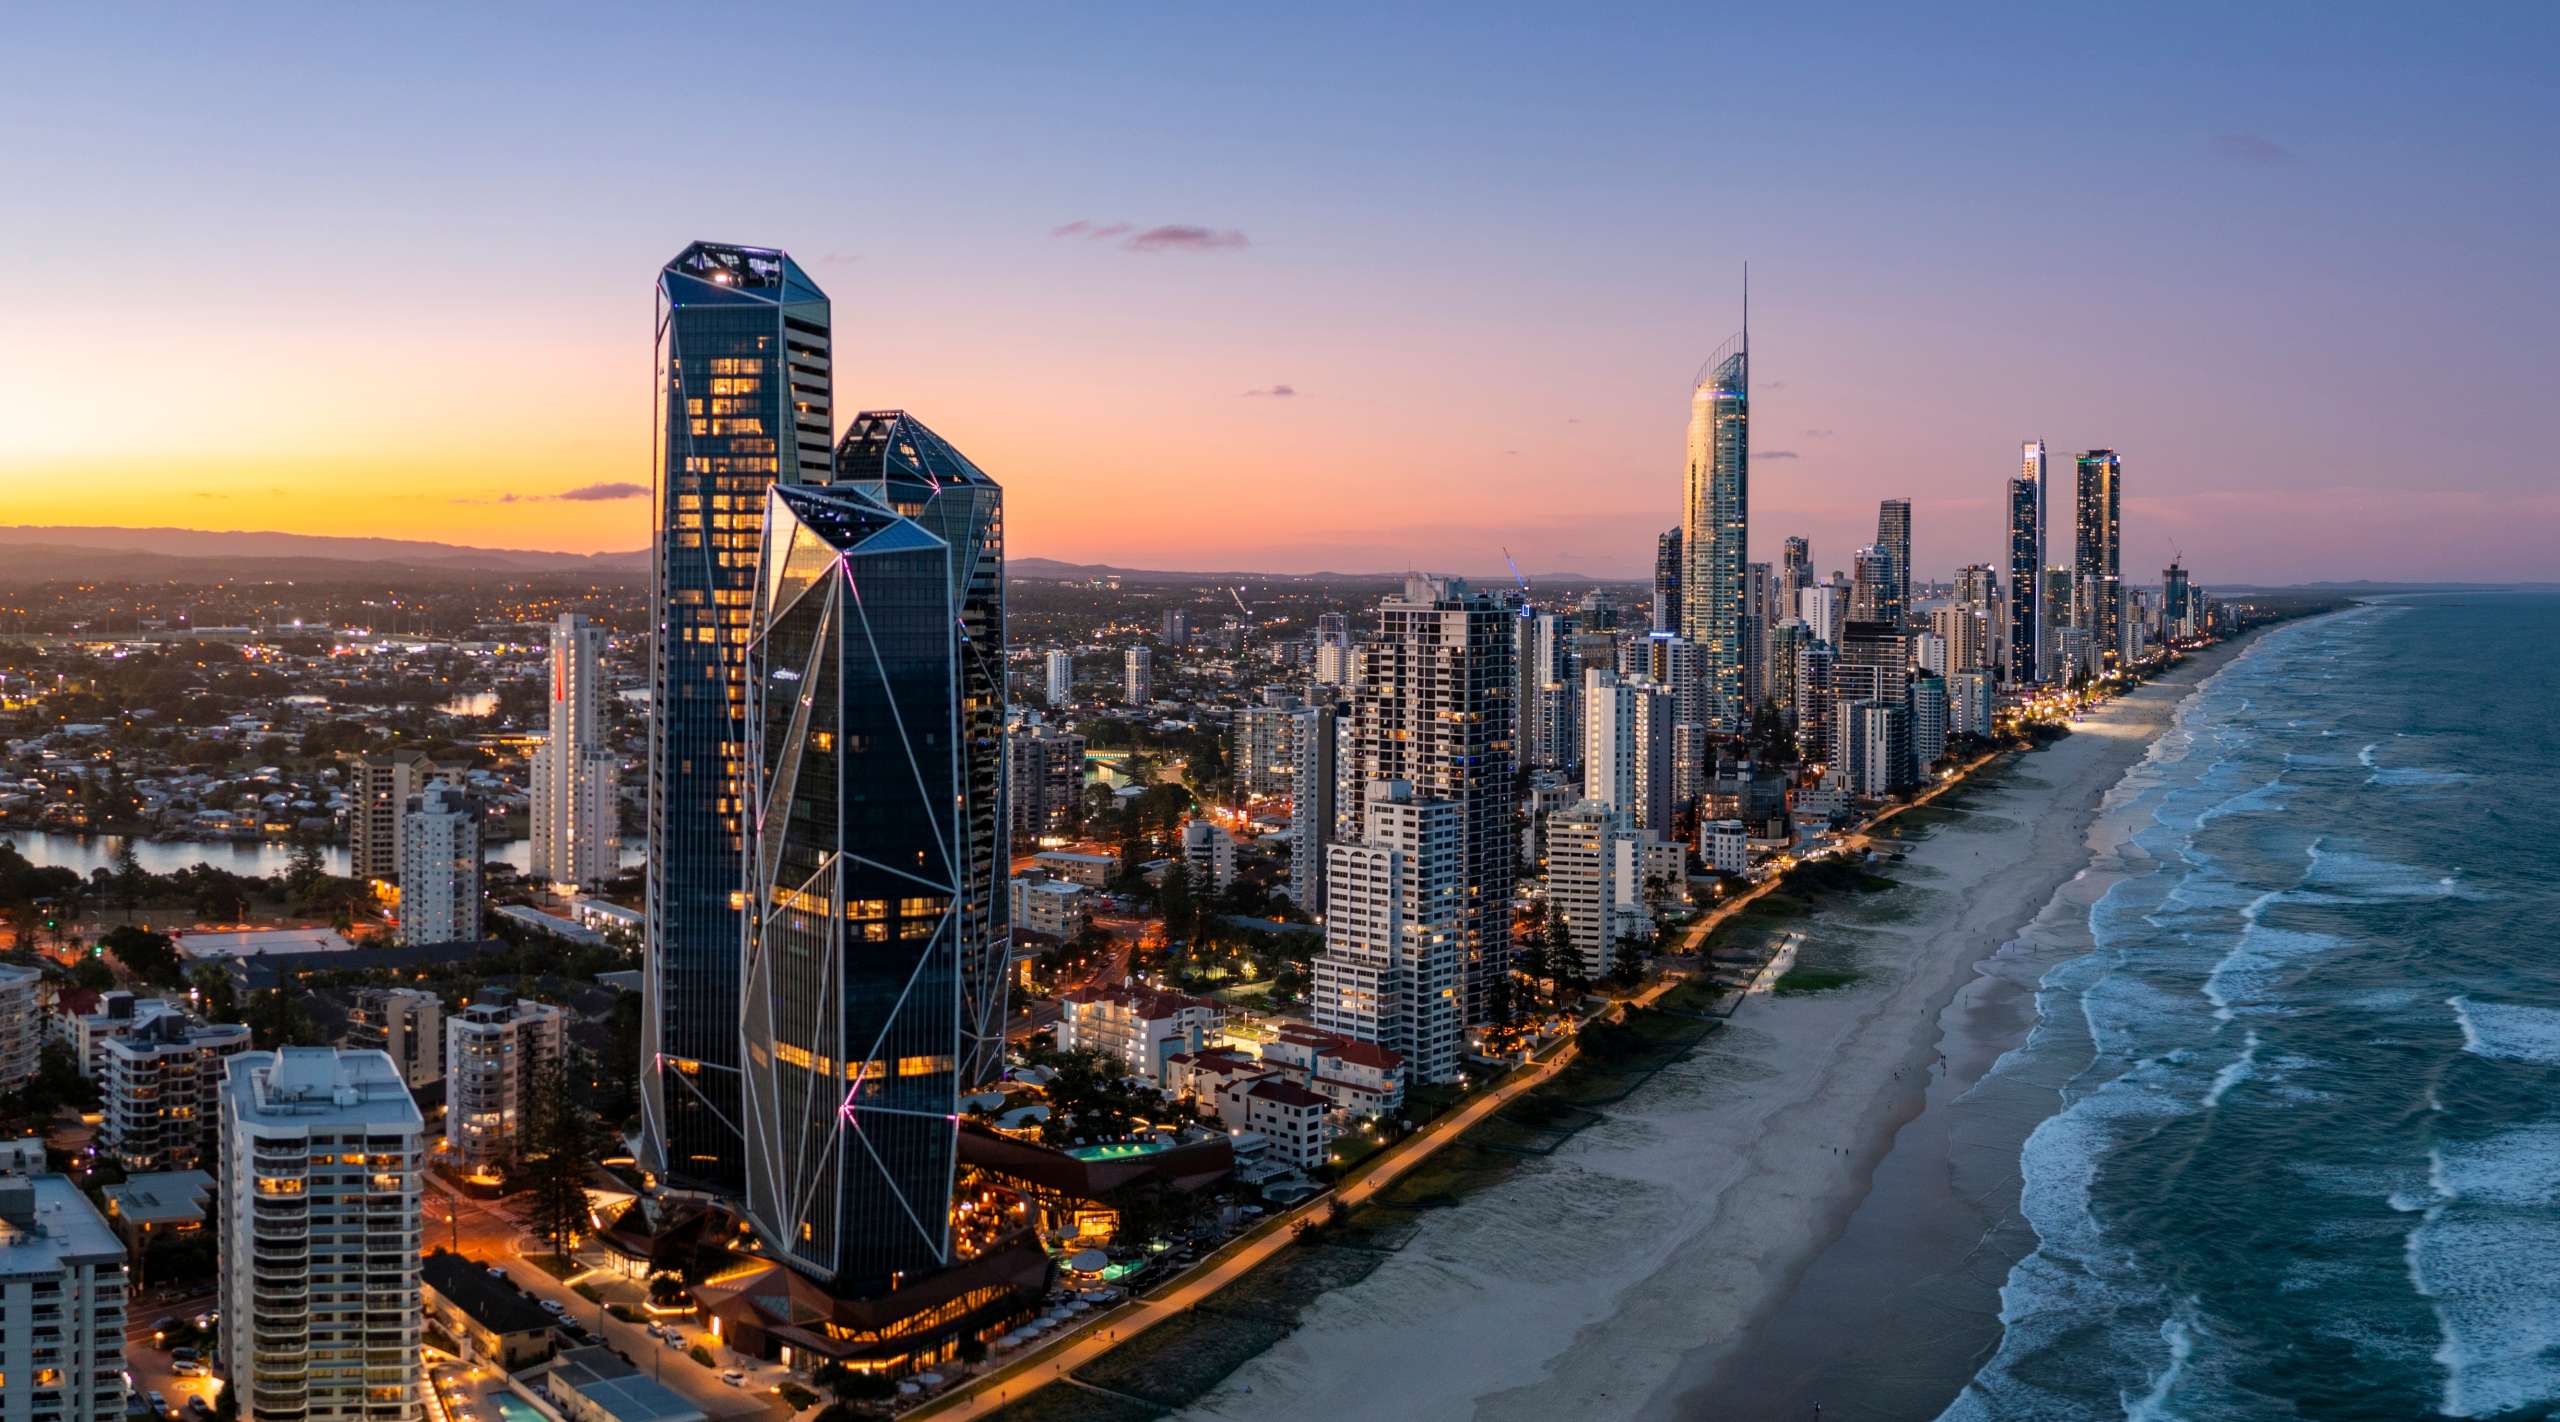
Australia’s Housing Market Enters a Cooling Phase Australia’s housing market shifted in June 2026, with the national Home Value Index falling 0.4% month-on-month. This was the largest monthly decline recorded since December 2022. Sydney experienced the sharpest correction, with dwelling values falling 1.2%, followed by Melbourne at 1.0% and Canberra at 0.6%. Adelaide remained unchanged, while Brisbane and Perth continued to grow by 0.3% and 0.7%respectively. Over the June quarter, national dwelling values declined 0.7%, while combined capital city values fell 1.3%. The slowdown was mainly driven by weaker buyer demand and growing affordability pressures. Market Conditions Become More Buyer-Friendly Higher interest rates, cost-of-living pressures, cautious buyer sentiment and recent property tax changes have contributed to softer market conditions. Auction clearance rates across the combined capital cities have remained below 50% since late May. Capital city sales volumes were also estimated to be 16.2% lower year-on-year. Meanwhile, advertised listings increased by almost 11% compared with the previous year. This has given buyers more options, reduced urgency and placed greater pressure on sellers to set realistic asking prices. Despite the national slowdown, market performance remains uneven. Perth recorded the strongest annual growth among the major capital cities at 23.9%, while Brisbane increased 17.4%, highlighting continued demand in selected markets. Outlook Australia’s housing market is likely to remain more balanced and selective in the coming months. Buyers may benefit from wider choice and improved negotiating power, while sellers will need to align pricing expectations with changing demand. Markets with stronger population growth, affordability and supply fundamentals, particularly Perth, may remain more resilient than Sydney and Melbourne. Download to see insights from other country marketsDownload

Australia Housing Market Slows in May 2026 Australia’s housing market showed clearer signs of slowing in May, with Cotality’s national Home Value Index remaining flat. The data suggests that momentum is easing across most regions as buyers face affordability pressure, tighter borrowing capacity and broader demand-side challenges. The slowdown was most visible in Sydney and Melbourne, where dwelling values fell by 0.9% and 0.8% respectively over the month. Both cities are now below their recent market peaks recorded in November last year. The ACT also softened slightly, with values down 0.2%. However, the market remains highly uneven. Perth and Darwin recorded the strongest monthly gains at 1.5%, followed by Brisbane and Hobart at 0.9%, and Adelaide at 0.5%. Cotality Research Director Tim Lawless noted that Australia’s housing market is moving at different speeds. Over the past five years, Perth home values surged 91.4%, while Melbourne rose only 3.3%, highlighting the gap between stronger and weaker city markets. Sales activity is also cooling. National home sales over the past three months were estimated to be 2.2% lower year-on-year and 4.1% below the five-year average. Sydney and Melbourne recorded the sharpest annual falls in sales, down 17.0% and 14.2% respectively. Outlook Looking ahead, Australia’s property market is expected to remain selective rather than broadly weak. Cities with stronger population growth, tighter supply and better affordability may continue to outperform. For buyers, rising listings and softer auction clearance rates could create more room to negotiate. For sellers, realistic pricing will be increasingly important as market conditions become more balanced. Juwai IQI Newsletter July 2026 RDownload
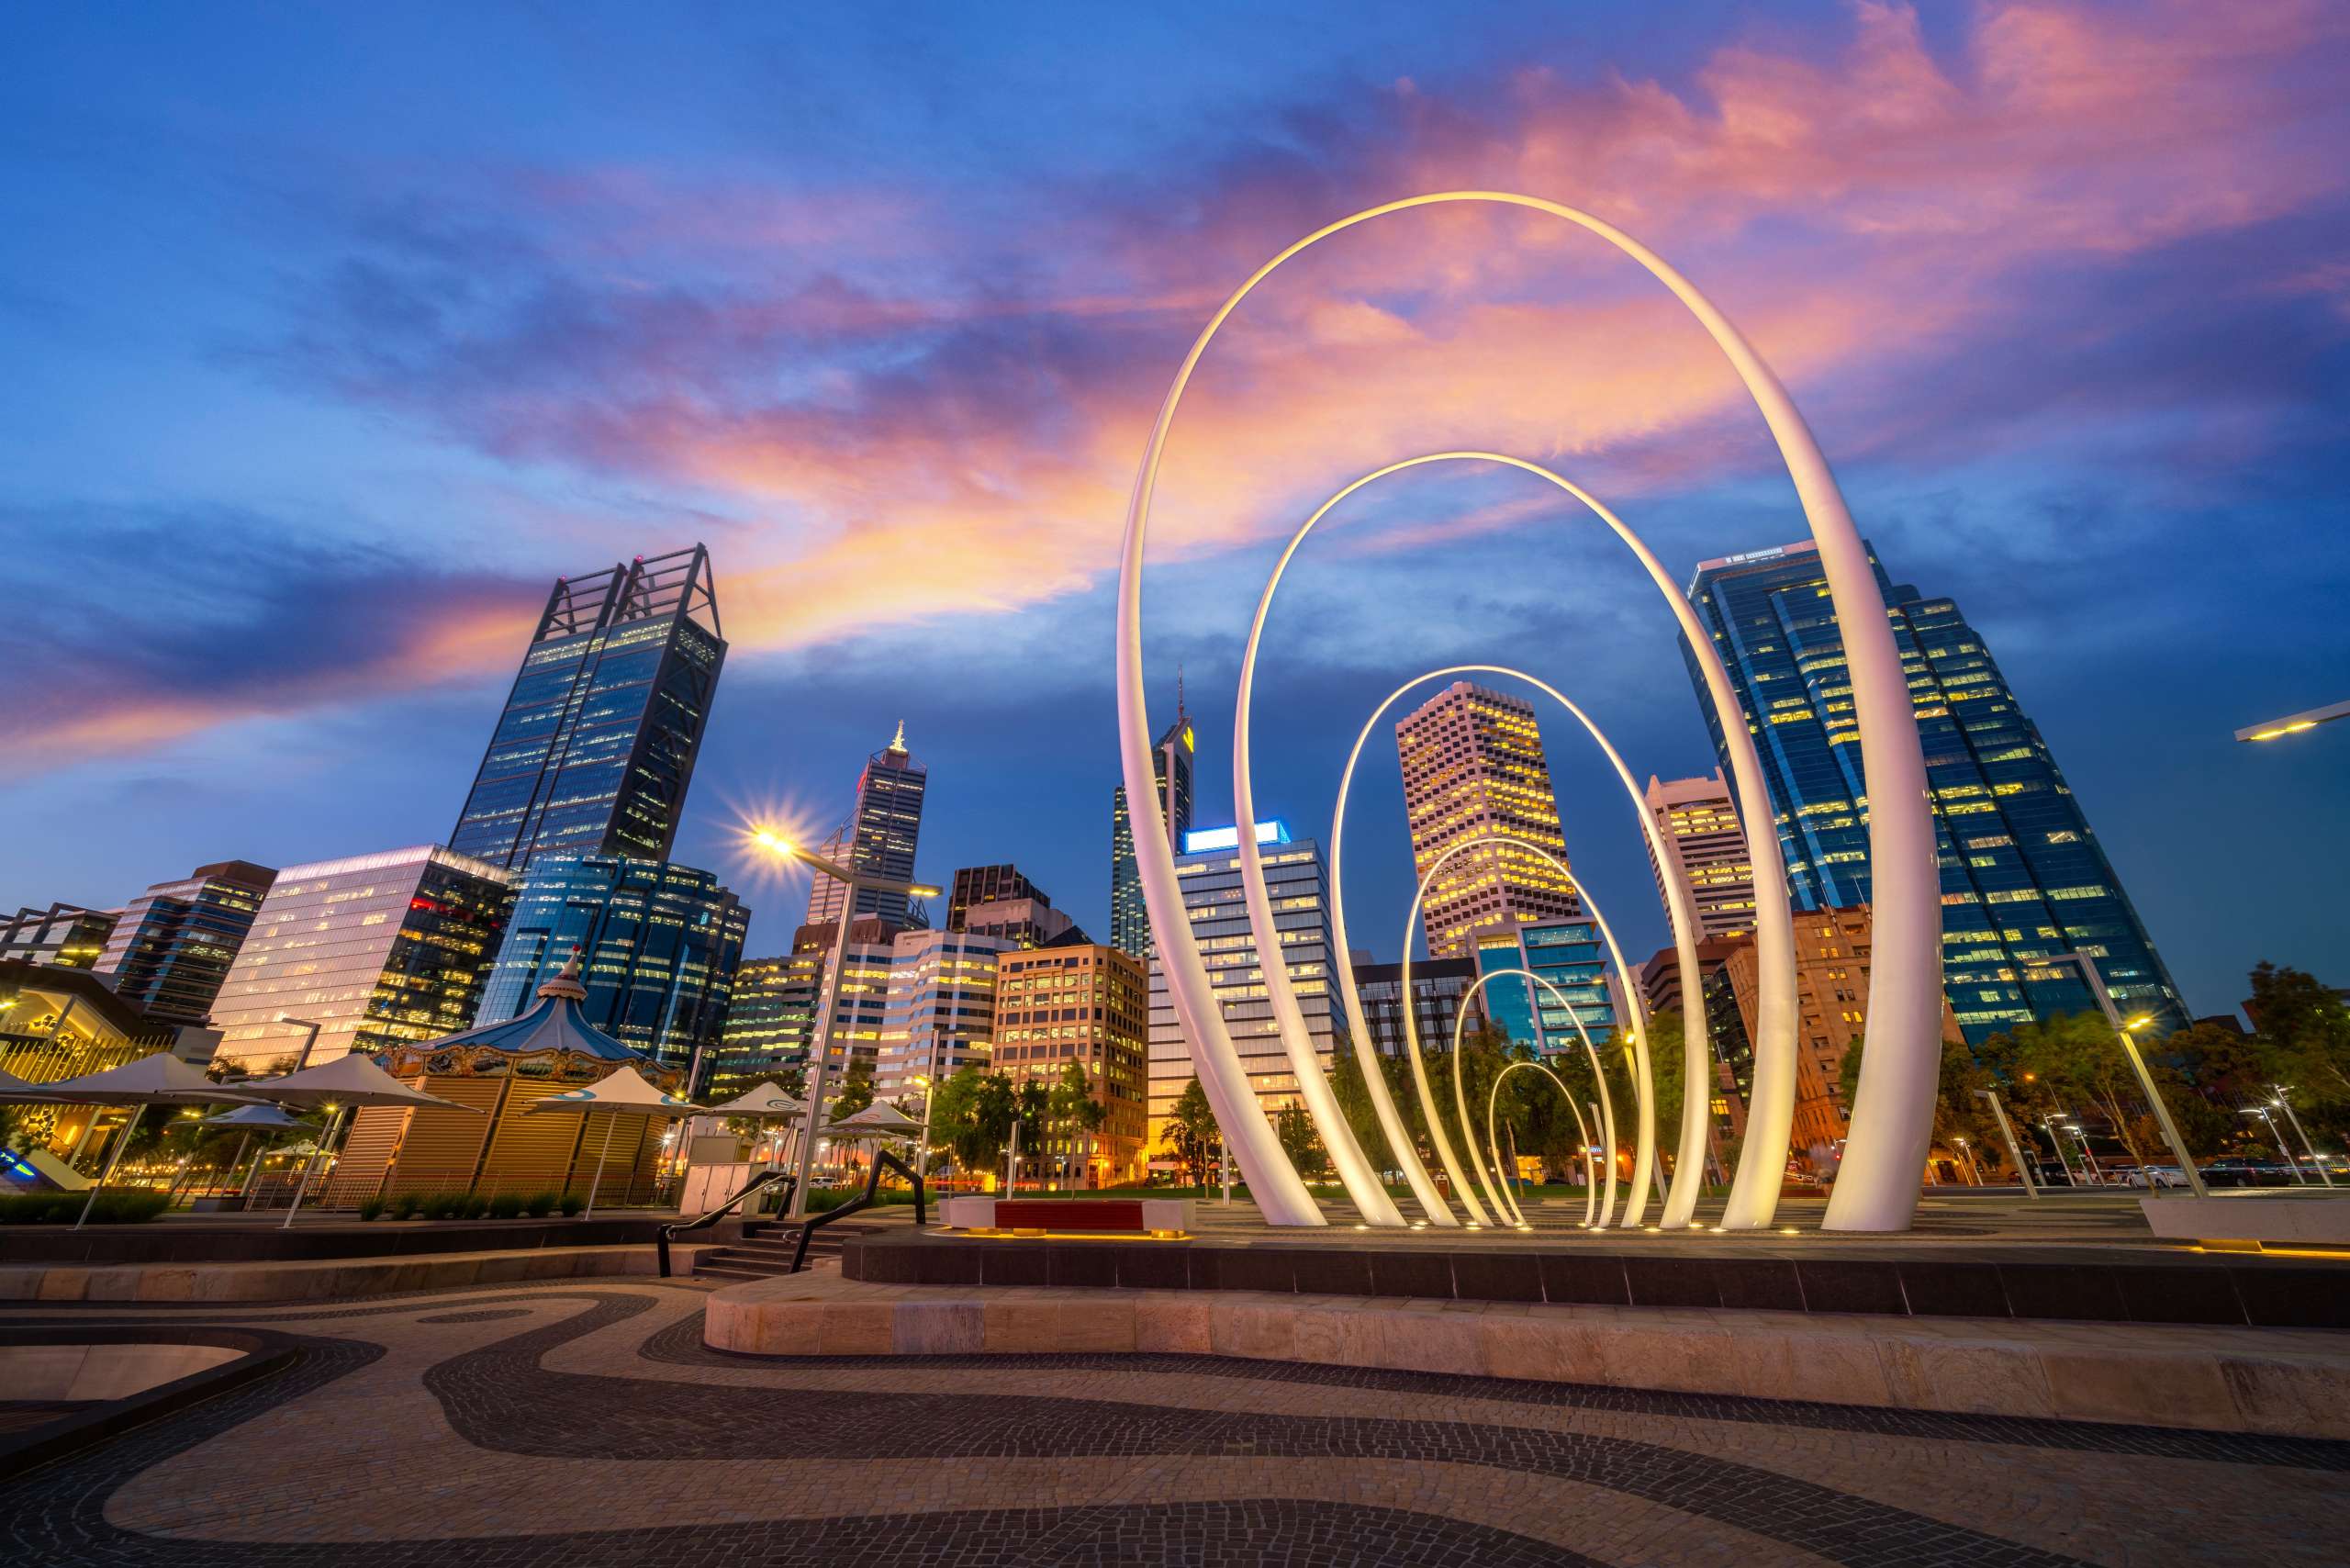
Australia’s housing market has entered 2026 with a clear split in performance across cities. While Sydney and Melbourne have begun to stabilise, mid-sized capitals continue to record solid growth, with several markets achieving more than 1% month-on-month increases. Perth Perth is leading the nation, with home values rising 2.3% in February alone, adding significant value to the median dwelling in just one month. Brisbane, Adelaide and Hobart also posted strong gains, reinforcing the growing strength of these markets as demand shifts beyond the traditional major cities. Sydney and Melbourne In contrast, Sydney and Melbourne were more sensitive to February’s rate hike and softer buyer sentiment. Property values in both cities remained flat over the month and showed slight declines over the rolling quarter, reflecting a more cautious market environment. A key factor supporting growth in the smaller capitals is limited housing supply. Perth listings remain significantly below historical averages, while Brisbane and Adelaide are also experiencing notable undersupply. Although stock levels in Sydney and Melbourne are still relatively tight, both cities have seen an increase in new listings, which may signal rising vendor activity amid softer conditions. At the same time, the more affordable end of the market continues to show resilience nationwide. In Sydney, lower-priced homes recorded modest growth, while higher-end properties declined. Ongoing demand from first-home buyers and investors, combined with tighter borrowing capacity at higher price points, continues to support entry-level segments. Overall, Australia’s property market is becoming more selective in 2026. For investors and homeowners, markets like Perth are presenting compelling opportunities, driven by strong growth, affordability, and supply constraints. As Australia’s property market shifts, opportunities are becoming more location-driven than ever. Whether you are exploring high-growth markets like Perth or reassessing your strategy in major cities, now is the time to make informed decisions. Connect with our team at sales@iqiwa.com.au to discover where the real opportunities are and take your next step with confidence. Download to see insights form other country marketsDownload
Ready to get started?
Get in touch now.