

Team Leader ∙ Dreammakerz
Kenny Loo
PEA2338
About Kenny Loo
Looking to buy, sell or rent a property? Look no further! As a professional real estate negotiator, I am here to assist you every step of the way.With 13 years of experience in the industry, I have a deep understanding of the local market and can provide valuable insights to help you make informed d... Looking to buy, sell or rent a property? Look no further! As a professional real estate negotiator, I am here to assist you every step of the way.With 13 years of experience in the industry, I have a deep understanding of the local market and can provide valuable insights to help you make informed decisions. Whether you're a first-time buyer or a seasoned investor, I am committed to helping you achieve your real estate goals.As your real estate negotiator, I will work tirelessly to ensure that your interests are represented and that you receive the best possible outcome. I will handle all negotiations on your behalf, ensuring that you get the best deal possible.So why wait? Contact me today to schedule a consultation and take the first step towards achieving your real estate goals. ALWAYS THERE FOR YOU , YOUR NEED MY PASSION ! Kenny Loo016 - 982 9831Team LeaderPEA 2338
7 years at IQI
324 transactions
46 properties on sale
2 properties on rent
Contact Kenny Loo
Kenny Loo's Service Locations
Kenny Loo's Service Locations
My Listings
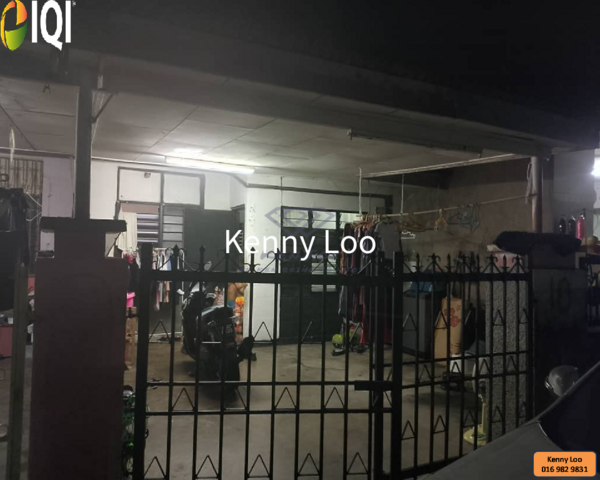
Taman tas
Taman tas
$ 64,173
Listed on October 22, 2025
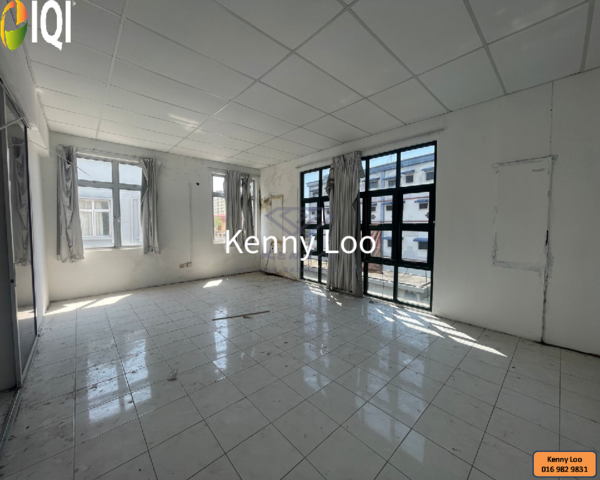
Lorong Tun Ismail
Lorong Tun Ismail
$ 73,341
Listed on April 2, 2026
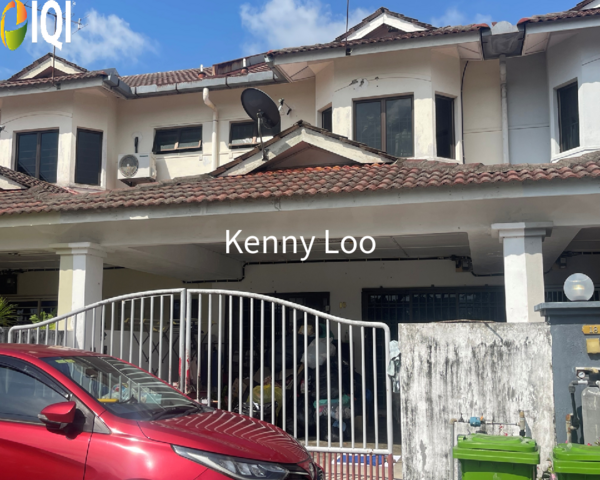
Seri Teruntum
Seri Teruntum
$ 162,196
Listed on July 18, 2026
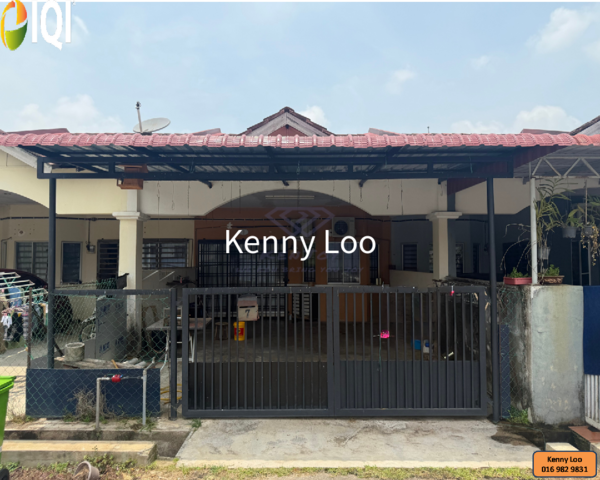
Seri Damai Baru
Seri Damai Baru
$ 91,676
Listed on September 2, 2026
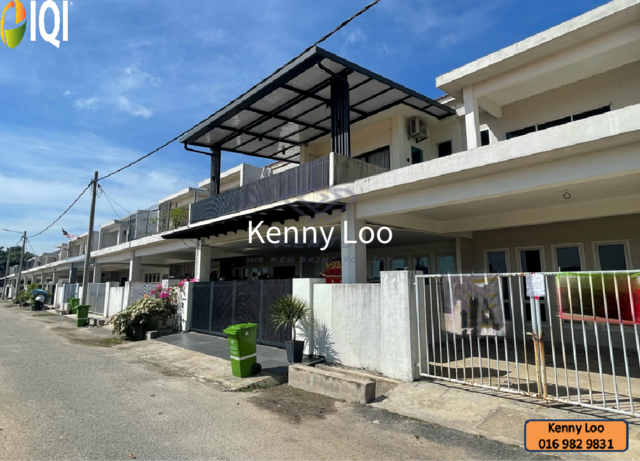
SERI TERUNTUM
Seri teruntum
$ 160,433
Listed on September 23, 2025

Taman Setali
Taman Setali
$ 76,867
Listed on June 12, 2025
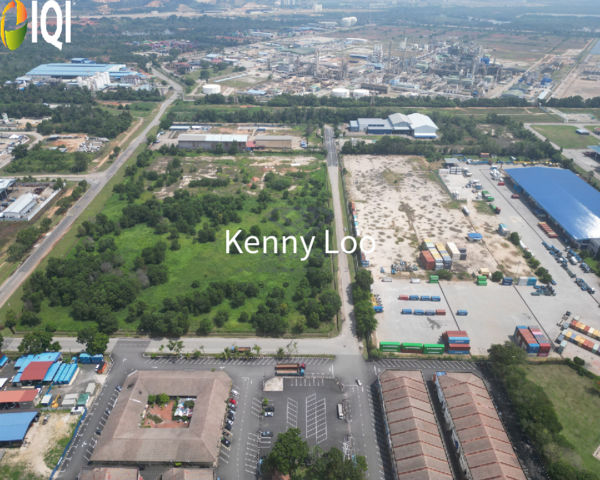
Kawasan Industri Gebeng
Gebeng
$ 1,763 /month
Listed on September 24, 2026
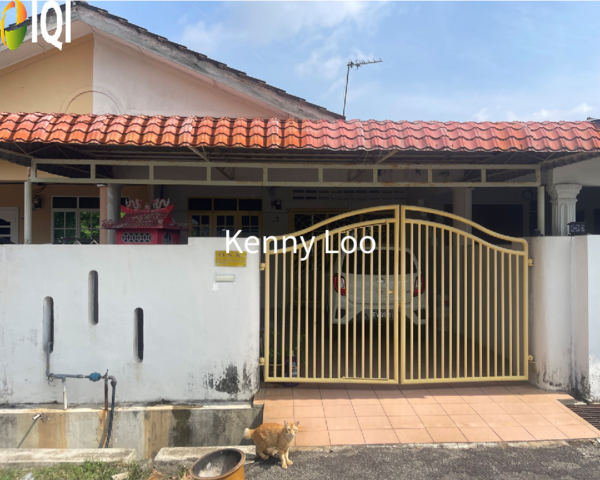
Lorong Bukit setongkol jaya
Lorong Bukit setongkol jaya
$ 126,936
Listed on August 8, 2026
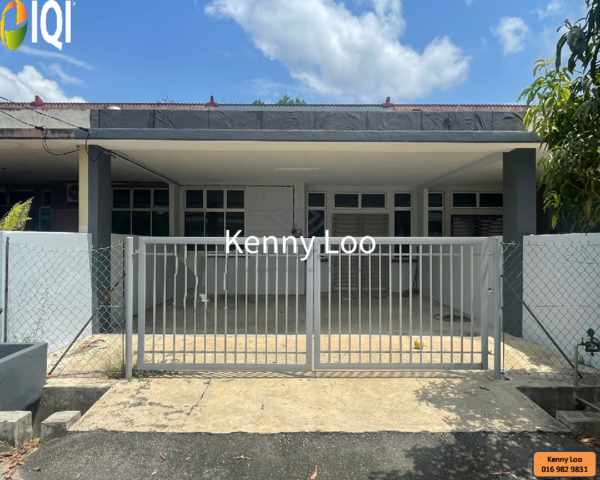
Pandan Aman
Pandan Aman
$ 96,965
Listed on June 19, 2025
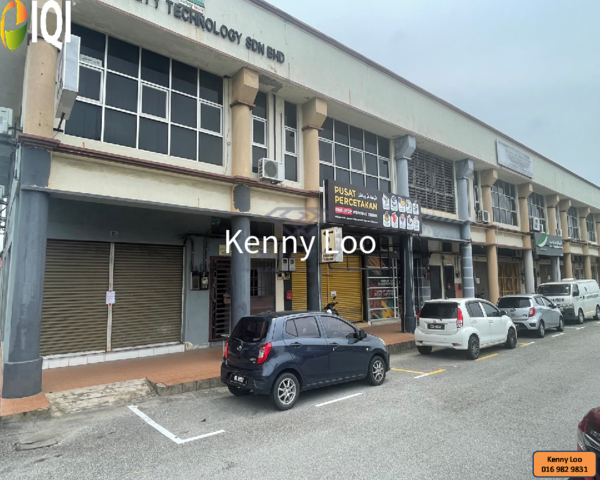
Indera Mahkota 16
Indera Mahkota 16
$ 211,560
Listed on July 15, 2025

Bukit Istana
Bukit Istana
$ 256,693
Listed on September 12, 2026
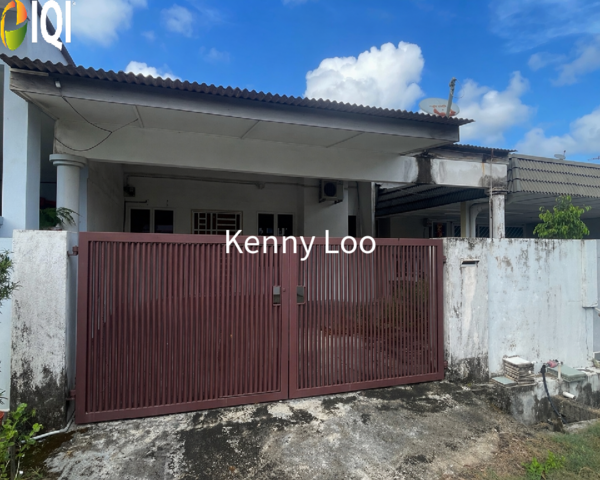
Lorong Air Putih 82
Lorong Air Putih 82
$ 130,462
Listed on April 25, 2026
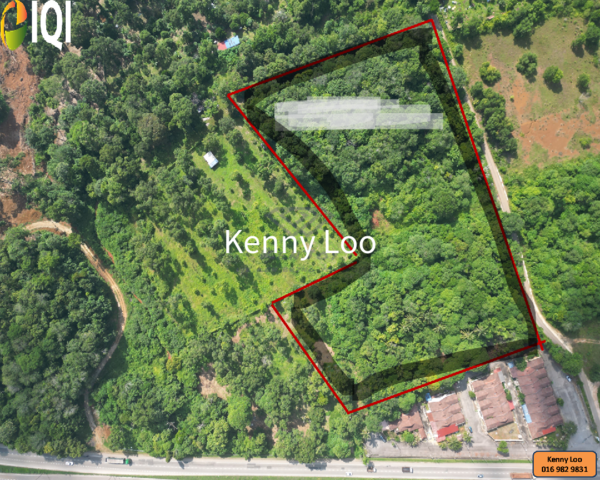
Lorong Dato Abd Rashid Salleh
Lorong Dato Abd Rashid Salleh
$ 1,692,480
Listed on August 28, 2026
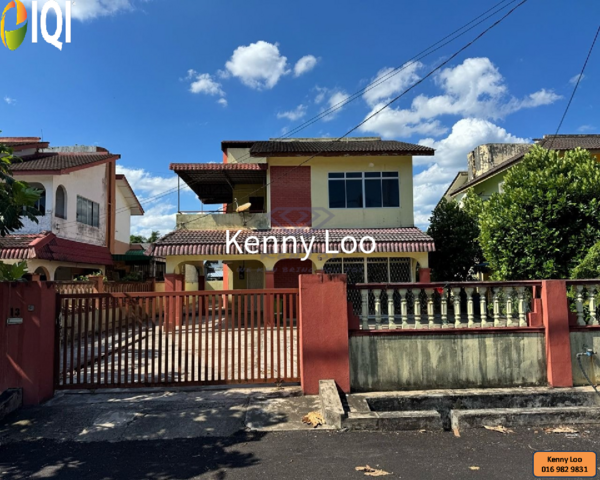
BUKIT SETONGKOL
BUKIT SETONGKOL
$ 267,271
Listed on September 24, 2026
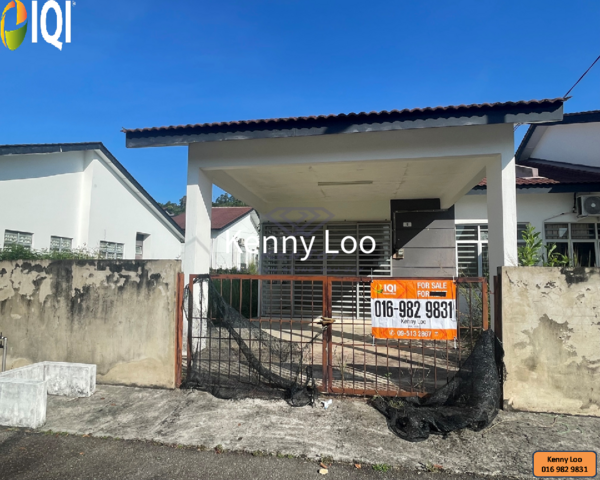
Seri Fajar Gambang
Seri Fajar Gambang
$ 89,913
Listed on June 19, 2025
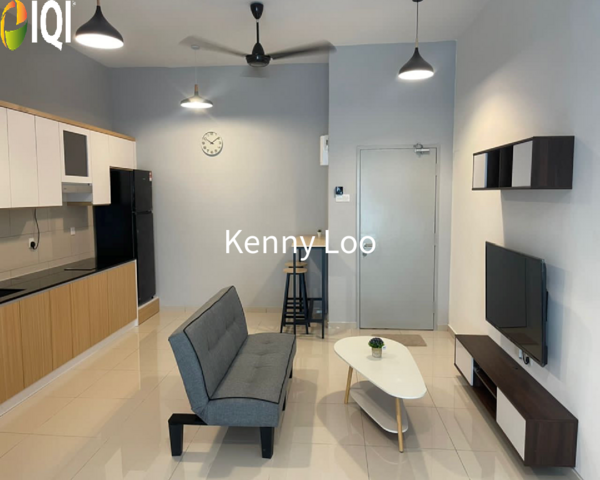
mahkota valley
mahkota valley
$ 82,861
Listed on July 28, 2026
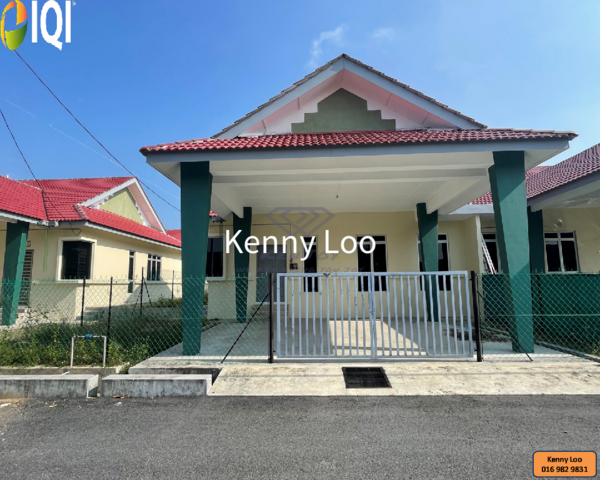
Taman Pandan Indah
Taman Pandan Indah
$ 128,699
Listed on August 2, 2025
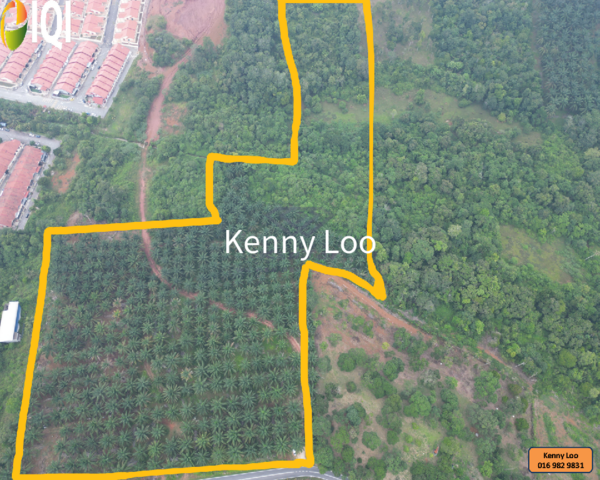
Sungai Karang
Sungai Karang
$ 775,720
Listed on September 24, 2026
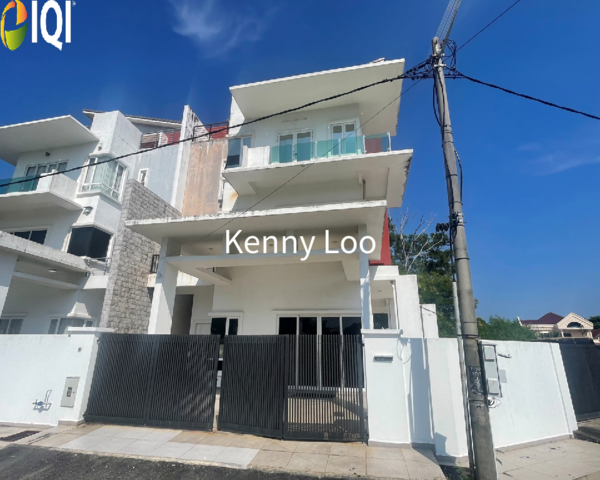
Tok Sira
Tok Sira
$ 592,368
Listed on August 7, 2026
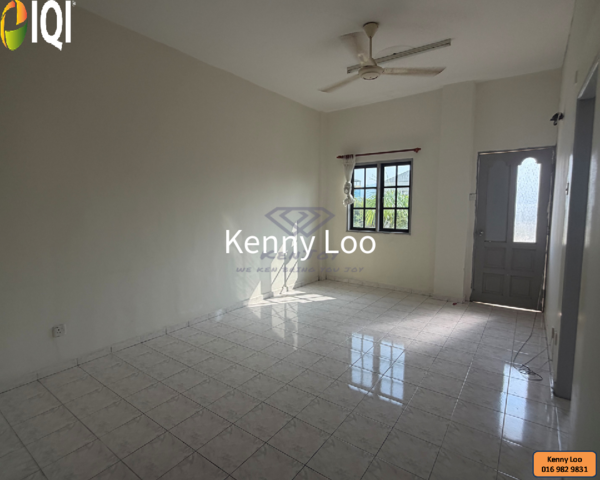
LE TOWN APARTMENT
LE TOWN APARTMENT
$ 74,046
Listed on September 1, 2026
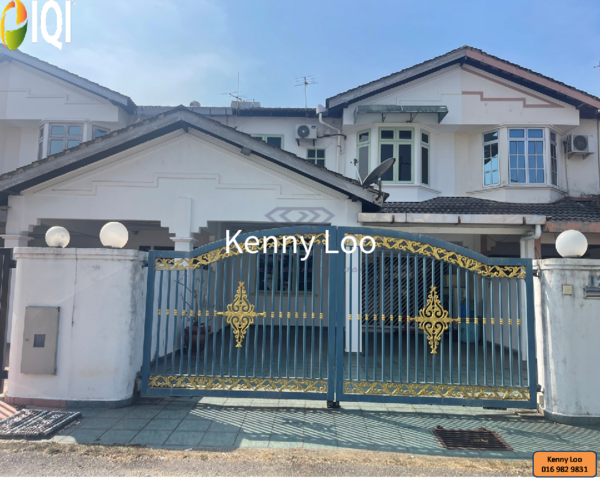
Lorong Air Putih 91
Lorong Air Putih 91
$ 163,959
Listed on April 30, 2026
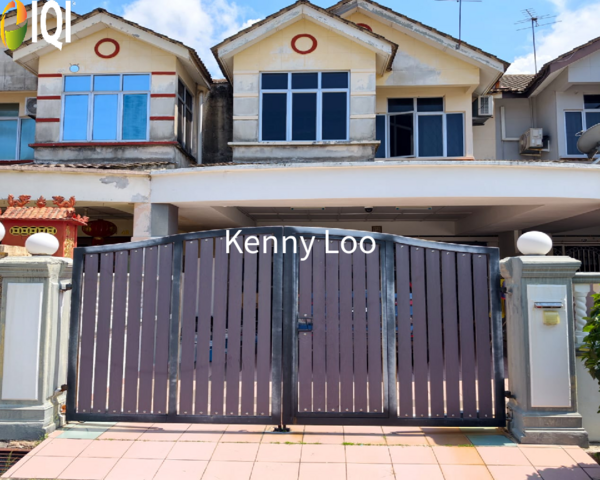
BUKIT UBI
LORONG BUKIT UBI
$ 158,670
Listed on August 11, 2026

kotasas
kotasas
$ 182,647
Listed on October 2, 2025
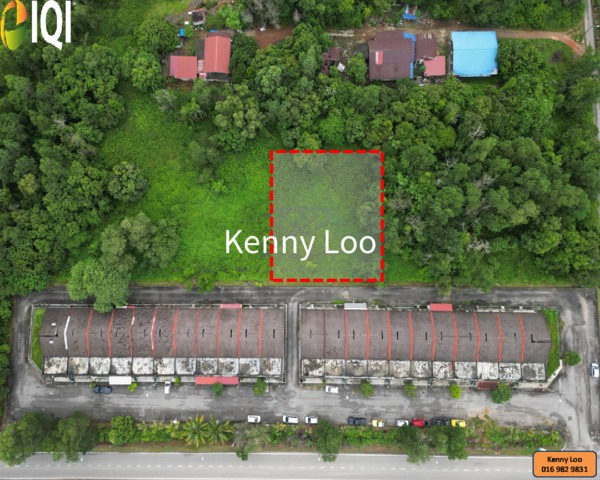
PERMATANG BADAK
Permatang Badak
$ 52,890
Listed on September 12, 2025
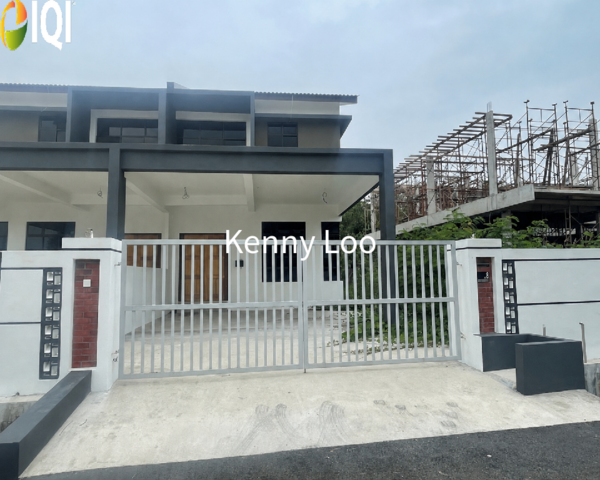
Bukit Setongkol Maju
Bukit Setongkol Maju
$ 262,758
Listed on August 28, 2026
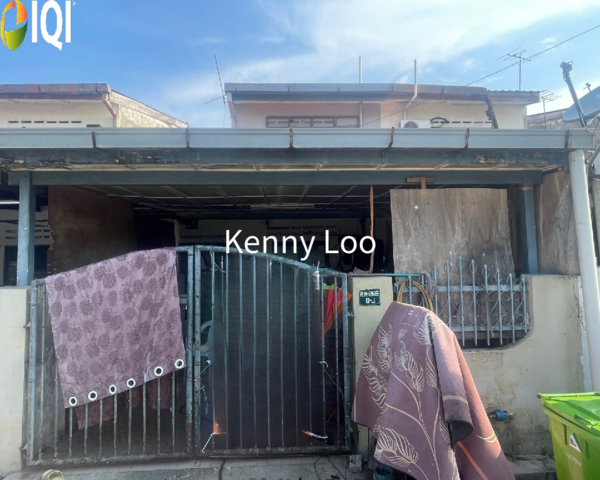
Taman Cenderawasih Indah
Taman Cenderawasih Indah
$ 63,468
Listed on August 1, 2026

Bukit Setongkol Maju
Bukit Setongkol Maju
$ 292,658
Listed on May 31, 2025

Semambu Baru
Semambu Baru
$ 176,300
Listed on May 21, 2025
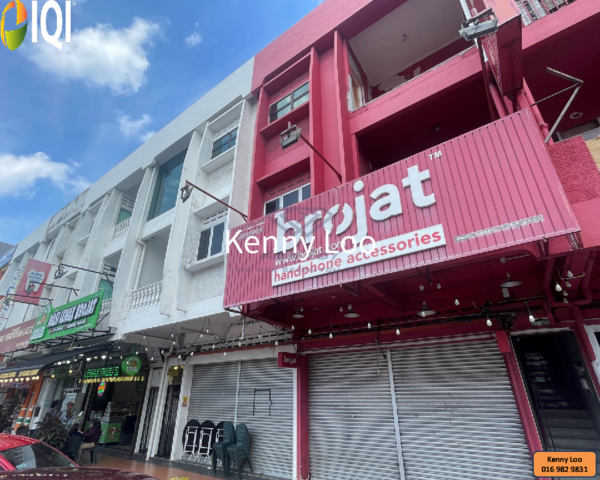
Jalan Penjara
Jalan Penjara
$ 387,860
Listed on July 18, 2026
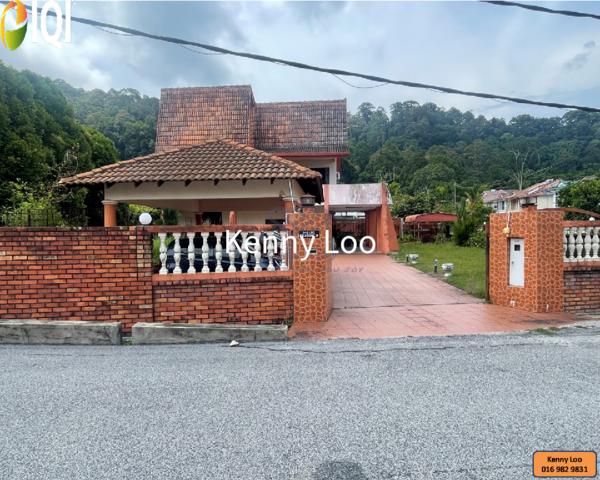
Bukit Pelindung
Bukit Pelindung
$ 881,500
Listed on August 11, 2026

Lorong Sekilau
Lorong Sekilau
$ 141,040
Listed on September 12, 2024
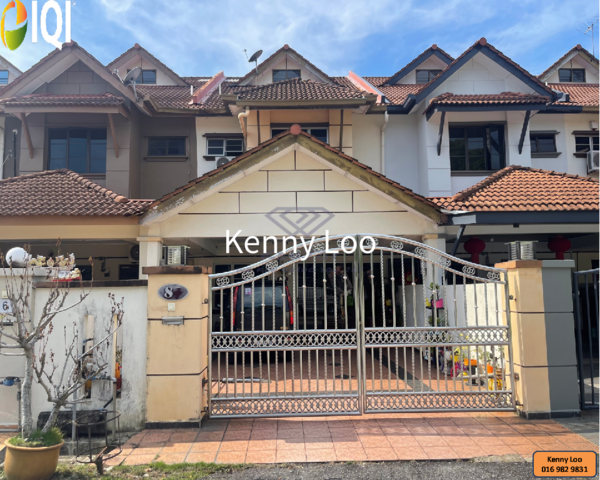
Lorong Galing
Lorong Galing
$ 211,207
Listed on April 14, 2026
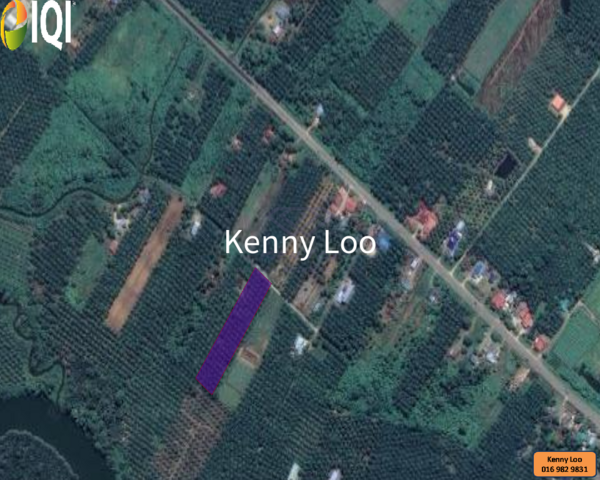
Rompin
Rompin
$ 101,549
Listed on August 29, 2026
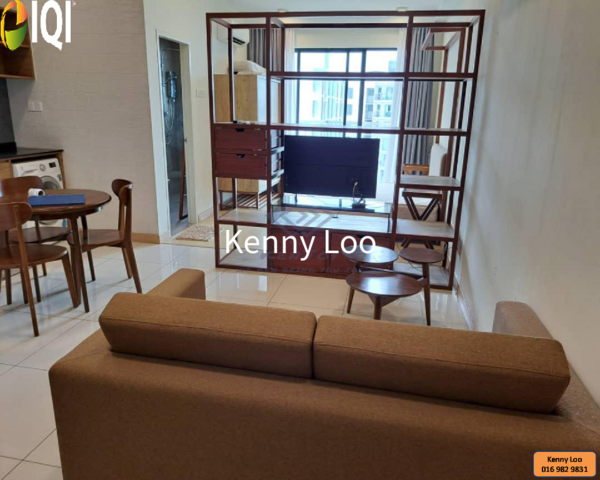
Timurbay Seafront Residence
Timurbay Seafront Residence
$ 158,670
Listed on August 28, 2026
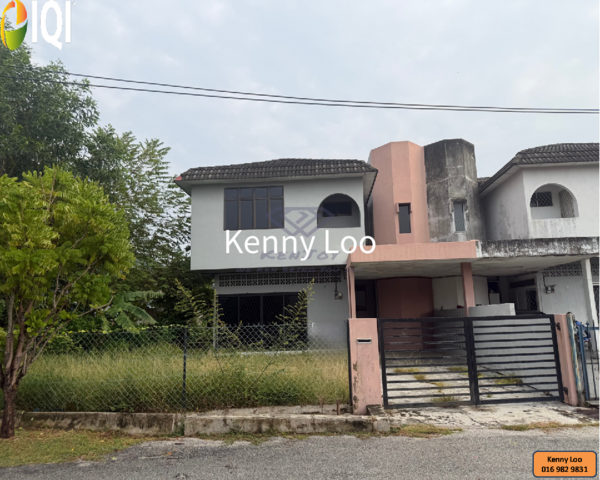
Jalan Haji Ahmad
Jalan Haji Ahmad
$ 302,531
Listed on August 29, 2026
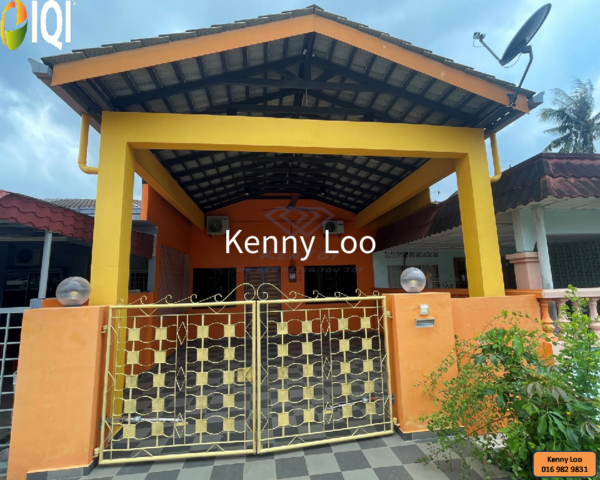
Wong Ah Jang
Wong Ah Jang
$ 141,040
Listed on August 30, 2025
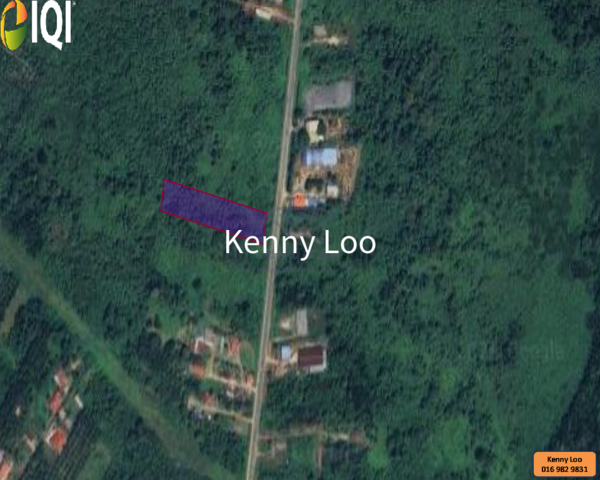
Rompin Pontian
Rompin Pontian
$ 140,335
Listed on August 29, 2026
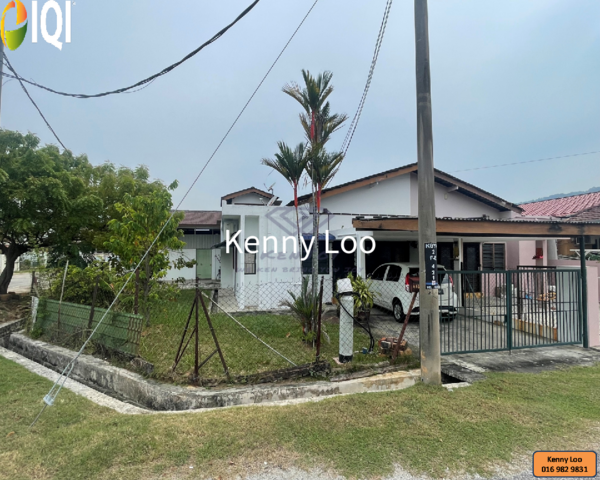
Alor Akar
Alor Akar
$ 157,965
Listed on August 27, 2025

Paya Tiga Bukit Setongkol
Paya Tiga Bukit Setongkol
$ 303,236
Listed on May 31, 2025

Seri Mahkota Makmur
Seri Mahkota Makmur
$ 86,387
Listed on May 23, 2025
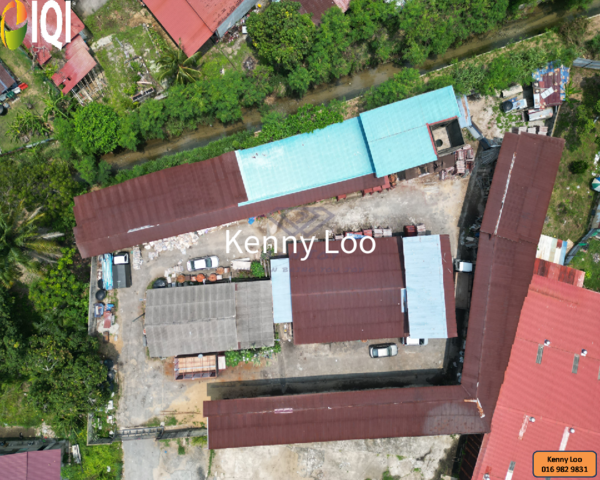
Haji Junid
Haji Junid
$ 264,450
Listed on September 17, 2026

Paya Tiga Bukit Setongkol
Paya Tiga Bukit Setongkol
$ 239,768
Listed on May 31, 2025
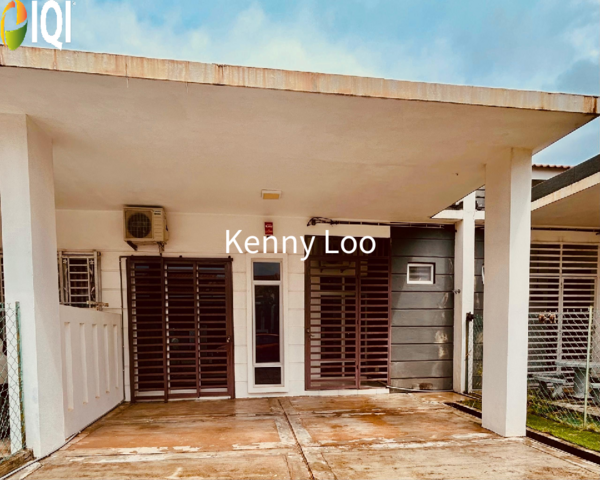
KotaSAS Precinct 5
kotasas
$ 128,699
Listed on July 28, 2026
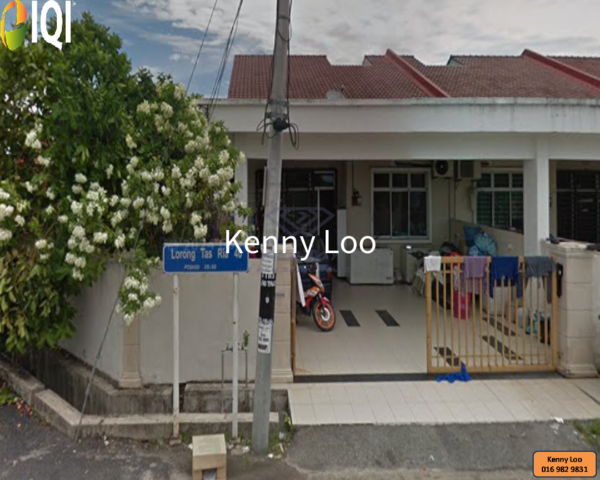
taman tas ria
taman tas ria
$ 148,057
Listed on October 14, 2025
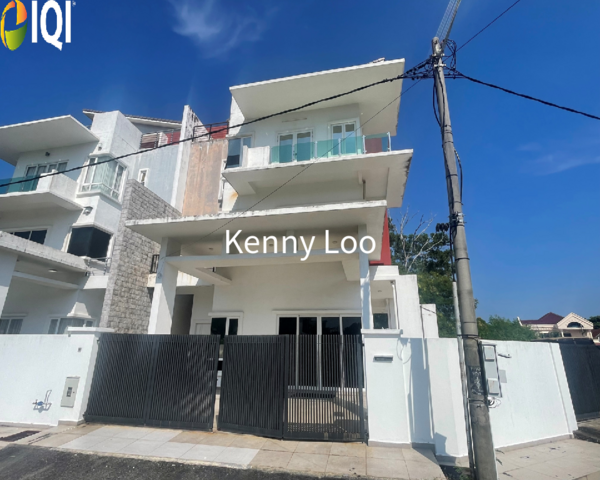
Tok Sira
Tok Sira
$ 1,234 /month
Listed on August 7, 2026
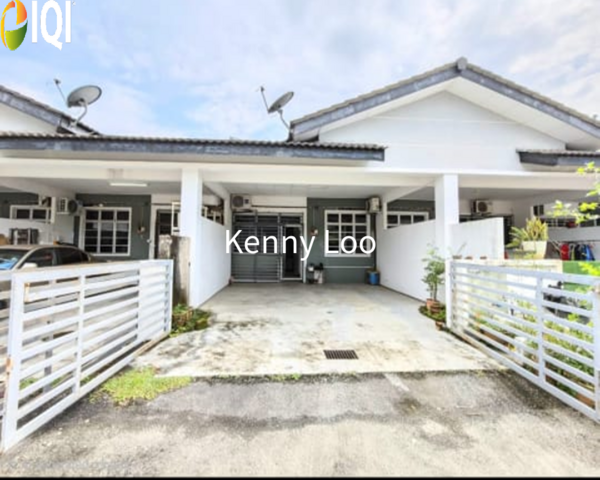
Kg Pak Mahat
Kg Pak Mahat
$ 95,202
Listed on September 2, 2026
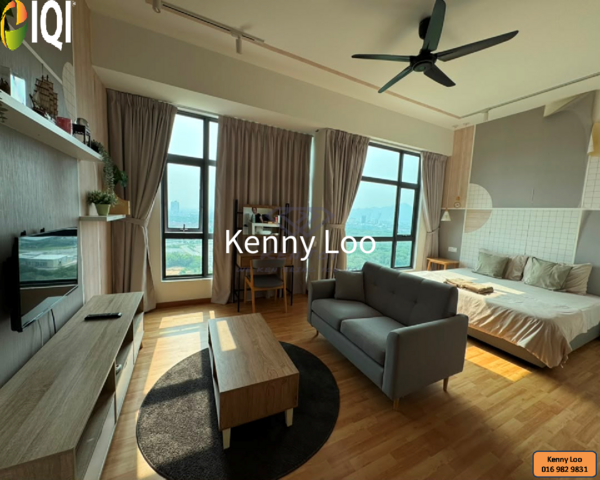
IMPERIUM RESIDENCE, KUANTAN WATERFRONT
IMPERIUM RESIDENCE
$ 123,410
Listed on August 29, 2026
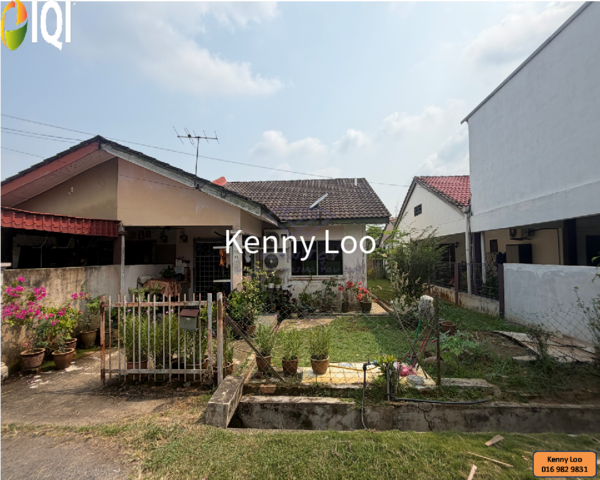
Indera Pura
Indera Pura
$ 77,572
Listed on September 25, 2026
Our newly launched projects
Discover the real estate properties in and around Kuantan, Malaysia. Buy apartment units, landed houses, bungalows, commercial office space, shop lots, and sub-sales with 100% confidence at IQI Global.
 Located in Kubang Semang
Northern TechValley @BKE
Mukim 14, Kubang Semang, 14400 Seberang Perai, Penang, Malaysia
Starting from $ 5,111,120
Listed on January 23, 2026
 Located in Bukit Minyak
Taman IKS Bukit Minyak
Jalan IKS Bukit Minyak Utama, Taman IKS Bukit Minyak, 14100 Simpang Ampat, Penang, Malaysia.
Starting from $ 424,460
Listed on January 23, 2026
 Industrial project type
Regalway Industrial Hub (Industrial)
Regalway Industrial Hub, Off Jalan Bukit Panchor, Bukit Panchor, 14100 Simpang Ampat, Penang, Malaysia.
Starting from $ 1,768,289
Listed on January 23, 2026
 Located in Bukit Mertajam
Taman Jasa Ria (Garden Villa)
Jalan Permatang Pasir, Taman Jasa Ria, 14000 Bukit Mertajam, Penang, Malaysia
Starting from $ 394,489
Listed on January 23, 2026
 Larger built-up area
Taman Jasa Intan (Garden Superlink)
Jalan Jasa Intan, Taman Jasa Intan, 14000 Bukit Mertajam, Penang, Malaysia
Starting from $ 288,427
Listed on January 23, 2026
 Large land area
Taman Fajar Permai (Sunrise Terrace)
Jalan Fajar, Taman Fajar Permai, 14300 Nibong Tebal, Penang, Malaysia.
Starting from $ 193,930
Listed on January 23, 2026
Mortgage Calculator
Calculate your estimated month repayment and plan your monthly expenses well.
The mortgage calculator is intended for reference only. Actual amount may vary.
Monthly Payment
Send me the mortgage calculator result

Home Loan Eligibility Calculator
Calculate your potential loan amount and assess your home buying affordability.

Rental Yield
Calculate the potential rental yield and evaluate a property's investment performance.

Down Payment Saving Plan
Create a structured savings plan and determine how much to save monthly for your down payment plan.

Malaysian Property Transaction Fees Calculator
Estimate the total transaction fees and budget accurately for your Malaysian property purchase.
IQI blog & news
Articles specifically curated for your daily digest of local and global real estate news.

Housing Weakness Spreads Across Capital Cities Australia’s housing slowdown intensified through winter, with home values declining across 93% of capital-city suburbs, more than double the 45.8% recorded during autumn. Darwin was the only capital city to avoid a decline over the three-month period. Cotality’s national Home Value Index fell 0.9% in August, marking the fifth consecutive monthly decline. National home values are now 3.6% below the March market peak. Sydney remained the weakest capital-city market, falling 1.4% in August and sitting 7.1% below its February peak. Melbourne and Canberra each declined 1.1%, while Brisbane fell 1.0%. Adelaide and Perth both recorded a 0.8% decrease, highlighting the increasingly broad nature of the downturn. Slower Sales Strengthen Buyer Conditions High borrowing costs, tighter lending conditions and affordability pressures continue to weigh on demand. Quarterly home sales were 15.5% lower than a year earlier and 11.5% below the five-year average, with Brisbane, Perth and Sydney recording annual declines of more than 20%. At the same time, capital-city listings were 24% higher than a year ago. Longer selling periods, greater vendor discounts and softer auction-clearance rates are creating more buyer-favourable conditions, although weak confidence continues to limit transaction activity. Outlook Australia’s housing market is likely to remain selective and buyer-driven in the near term. Elevated stock levels and softer demand may continue to pressure values, while buyers with strong financing positions could benefit from greater choice and improved negotiating power. For investors and homeowners, markets such as Perth may still present opportunities for those taking a long-term view. The contents of this article were contributed by Lily Chong, Head of IQI Australia. Download to see insights from other country marketsDownload
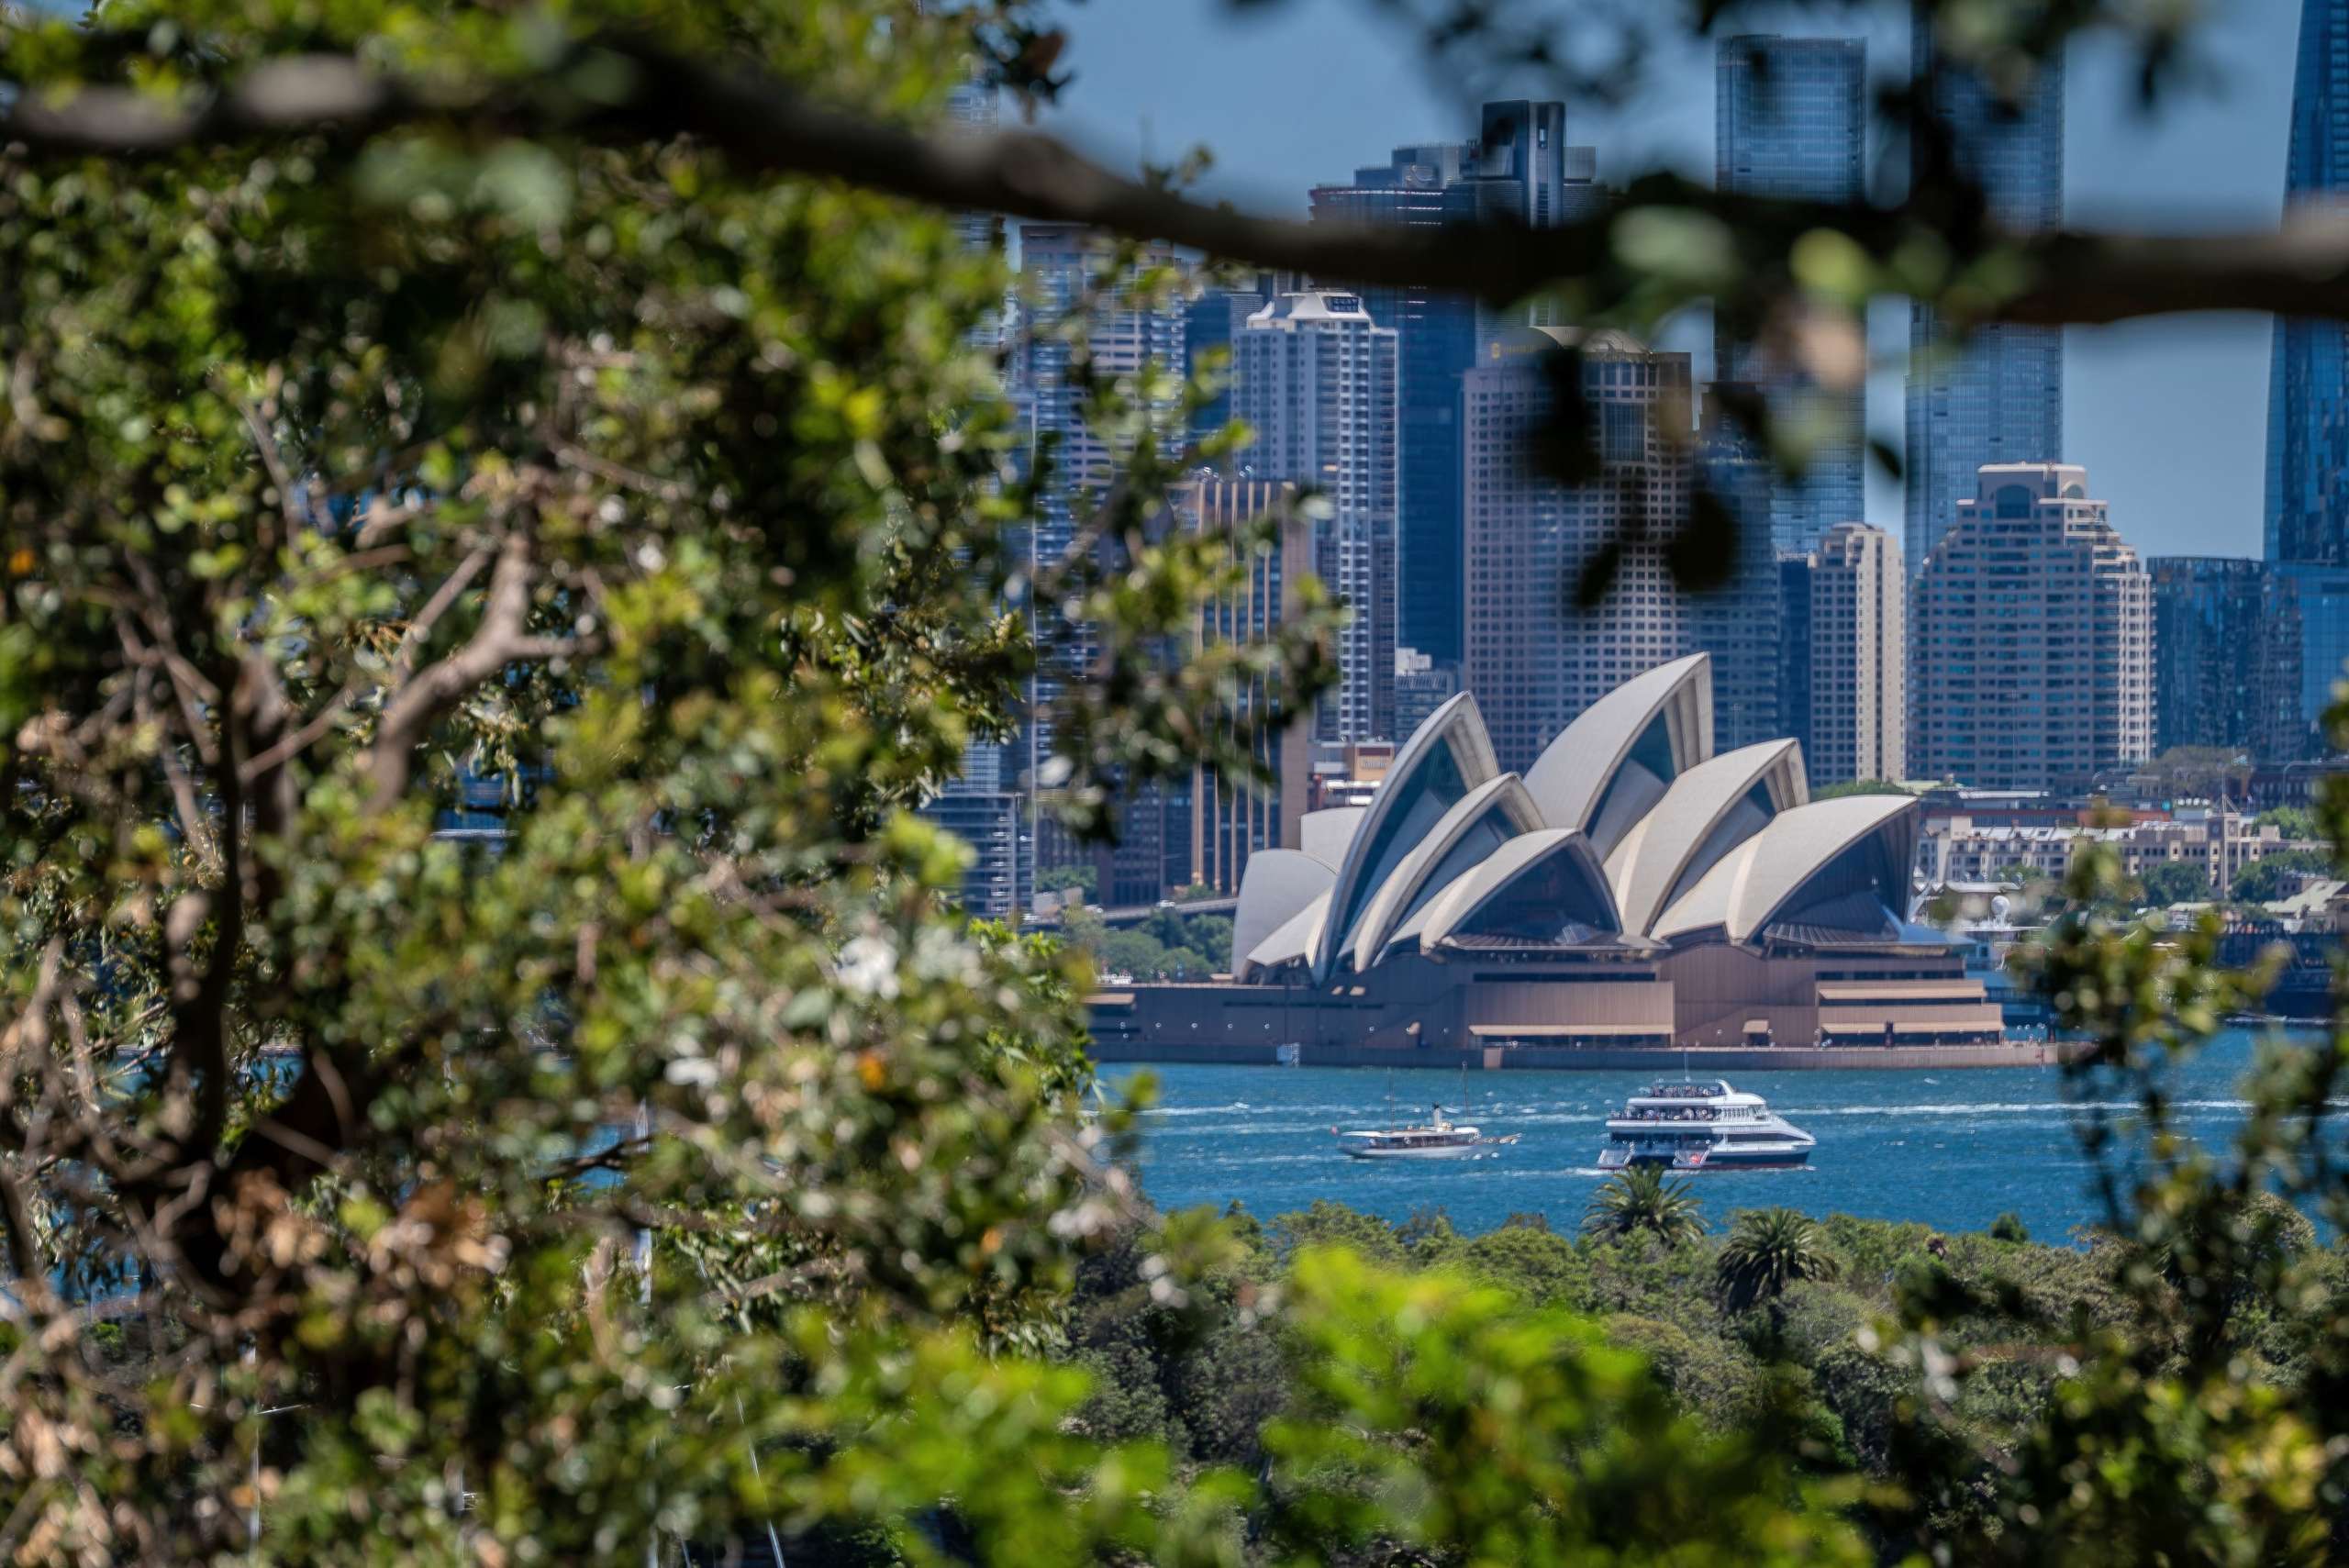
Australia’s Housing Downturn Spreads Australia’s housing market lost further momentum in July, with Cotality’s national Home Value Index falling 0.7%, its largest monthly decline in more than three years. Sydney and Melbourne remained the weakest major markets, with home values falling 1.4% and 1.2% respectively during the month. However, the slowdown is becoming more widespread. Brisbane declined 0.6%, while Adelaide fell 0.2%, with both cities recording two consecutive months of falling values following historical revisions. Perth showed a small 0.1% monthly increase, although its June result was revised to a 0.5% decline, signalling how quickly conditions have shifted from the city’s earlier growth phase. Premium Homes Feel More Pressure The correction has been particularly noticeable at the higher end of the market. Values in the upper quartile fell 3.2% over the three months to July, compared with a 0.3% gain among lower-value properties. Several factors are weighing on demand, including affordability constraints, three cash-rate increases and weak consumer confidence. At the same time, advertised housing supply has increased. Capital-city auction clearance rates have remained below 50%, suggesting buyers and sellers are still struggling to agree on pricing. Outlook Australia’s housing market is likely to remain price-sensitive and uneven across cities and property segments in the near term. With higher-value homes experiencing the greatest pressure, buyers may gain greater negotiating power in selected markets. For homeowners and investors, conditions will require closer attention to local demand, pricing and affordability rather than relying on broader national trends. The contents of this article were contributed by Lily Chong, Head of IQI Australia. Download to see insights from other country marketsDownload
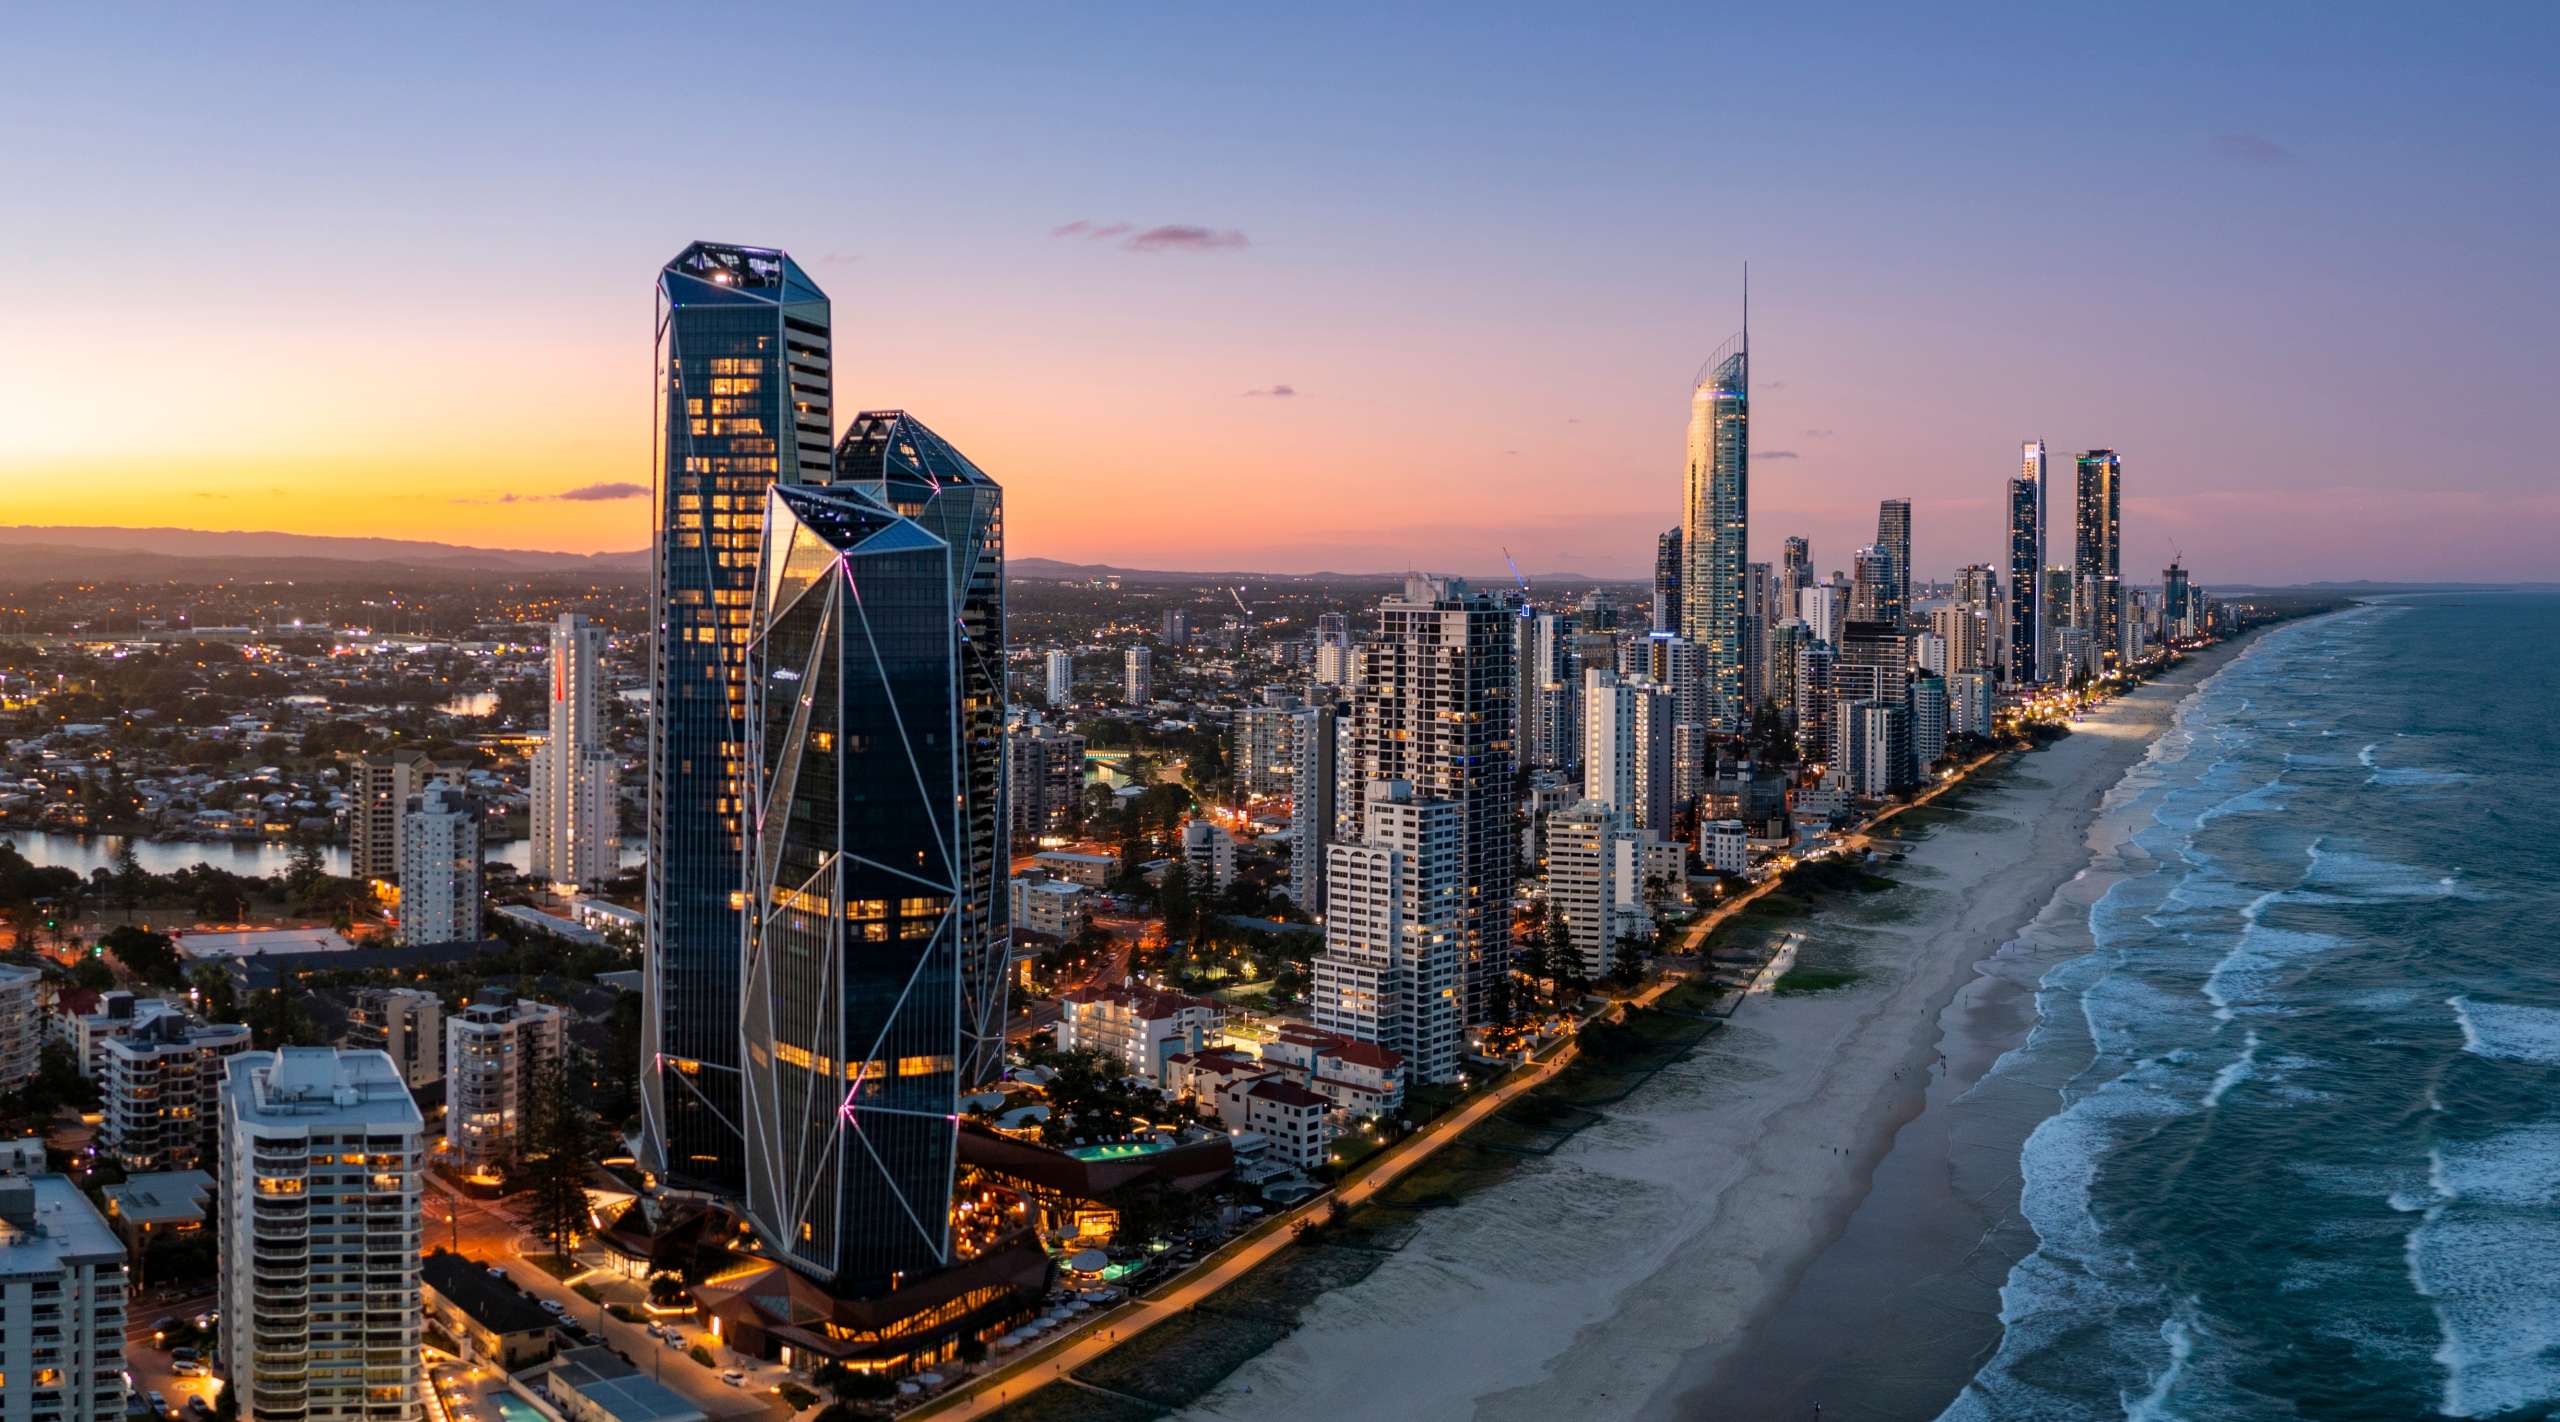
Australia’s Housing Market Enters a Cooling Phase Australia’s housing market shifted in June 2026, with the national Home Value Index falling 0.4% month-on-month. This was the largest monthly decline recorded since December 2022. Sydney experienced the sharpest correction, with dwelling values falling 1.2%, followed by Melbourne at 1.0% and Canberra at 0.6%. Adelaide remained unchanged, while Brisbane and Perth continued to grow by 0.3% and 0.7%respectively. Over the June quarter, national dwelling values declined 0.7%, while combined capital city values fell 1.3%. The slowdown was mainly driven by weaker buyer demand and growing affordability pressures. Market Conditions Become More Buyer-Friendly Higher interest rates, cost-of-living pressures, cautious buyer sentiment and recent property tax changes have contributed to softer market conditions. Auction clearance rates across the combined capital cities have remained below 50% since late May. Capital city sales volumes were also estimated to be 16.2% lower year-on-year. Meanwhile, advertised listings increased by almost 11% compared with the previous year. This has given buyers more options, reduced urgency and placed greater pressure on sellers to set realistic asking prices. Despite the national slowdown, market performance remains uneven. Perth recorded the strongest annual growth among the major capital cities at 23.9%, while Brisbane increased 17.4%, highlighting continued demand in selected markets. Outlook Australia’s housing market is likely to remain more balanced and selective in the coming months. Buyers may benefit from wider choice and improved negotiating power, while sellers will need to align pricing expectations with changing demand. Markets with stronger population growth, affordability and supply fundamentals, particularly Perth, may remain more resilient than Sydney and Melbourne. Download to see insights from other country marketsDownload

Australia Housing Market Slows in May 2026 Australia’s housing market showed clearer signs of slowing in May, with Cotality’s national Home Value Index remaining flat. The data suggests that momentum is easing across most regions as buyers face affordability pressure, tighter borrowing capacity and broader demand-side challenges. The slowdown was most visible in Sydney and Melbourne, where dwelling values fell by 0.9% and 0.8% respectively over the month. Both cities are now below their recent market peaks recorded in November last year. The ACT also softened slightly, with values down 0.2%. However, the market remains highly uneven. Perth and Darwin recorded the strongest monthly gains at 1.5%, followed by Brisbane and Hobart at 0.9%, and Adelaide at 0.5%. Cotality Research Director Tim Lawless noted that Australia’s housing market is moving at different speeds. Over the past five years, Perth home values surged 91.4%, while Melbourne rose only 3.3%, highlighting the gap between stronger and weaker city markets. Sales activity is also cooling. National home sales over the past three months were estimated to be 2.2% lower year-on-year and 4.1% below the five-year average. Sydney and Melbourne recorded the sharpest annual falls in sales, down 17.0% and 14.2% respectively. Outlook Looking ahead, Australia’s property market is expected to remain selective rather than broadly weak. Cities with stronger population growth, tighter supply and better affordability may continue to outperform. For buyers, rising listings and softer auction clearance rates could create more room to negotiate. For sellers, realistic pricing will be increasingly important as market conditions become more balanced. Juwai IQI Newsletter July 2026 RDownload
Ready to get started?
Get in touch now.
