

Team Leader (Subsales) ∙ United
Alvin Cham
REN37907
About Alvin Cham
凭借丰富的市场知识和卓越的谈判技巧,为您带来非凡的成果。您的置业成功是我的首要任务。准备好将您的置业梦想变为现实了吗?让我们聊聊吧。您的梦想家园正在等待着您。
6 years at IQI
82 transactions
41 properties on sale
3 properties on rent
Alvin Cham Social Links
No social links available.
Alvin Cham's Service Locations
Alvin Cham's Service Locations
My Listings
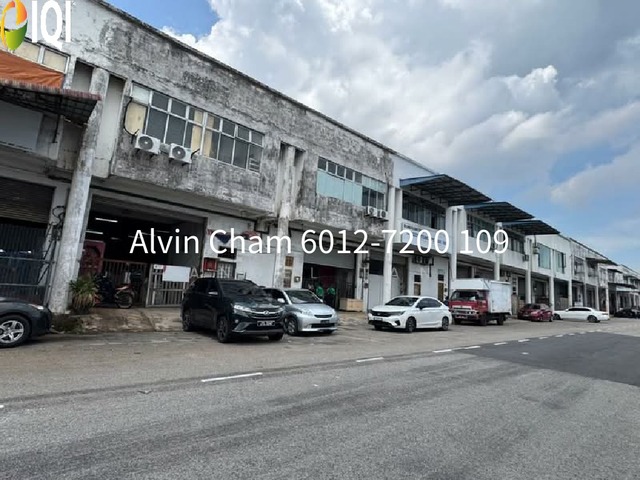
Taman Industri Jaya
Jalan Bistari
$ 460,416
Listed on September 22, 2026
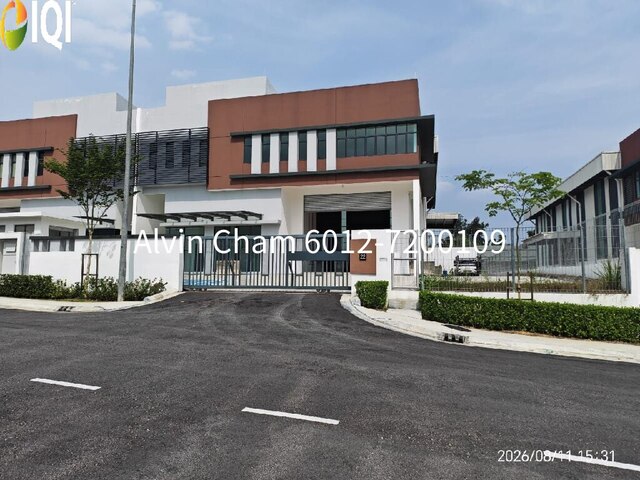
Taman Perindustrian Desa Cemerlang
Jalan Desa Cemerlang
$ 1,683,396
Listed on September 9, 2026
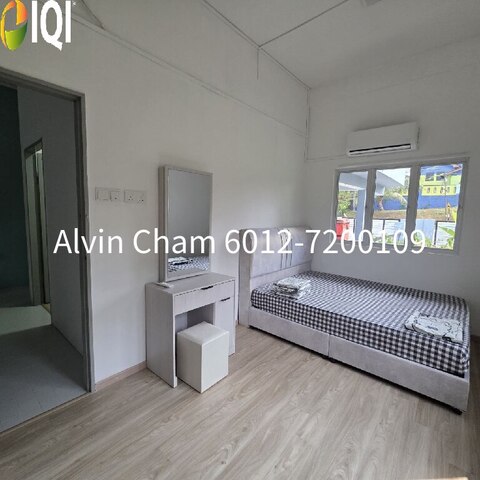
Kampung Bahru
Jalan Abdul Samad
$ 4,316 /month
Listed on September 21, 2026

Residensi Masai (Parc Regency)
Jalan Masai Jaya, Off Jalan Masai Baru
$ 111,507
Listed on October 7, 2026

AmberSide @ Country Garden Danga Bay
Danga Bay, Johor Bahru, Johor
$ 125,535
Listed on October 9, 2026

Taman Pelangi Indah
Jalan Ayu
$ 395,670
Listed on October 22, 2026

Dedaun Hijau (Greenfield Regency)
Taman Tampoi Indah, Johor Bahru
$ 158,268
Listed on October 5, 2026
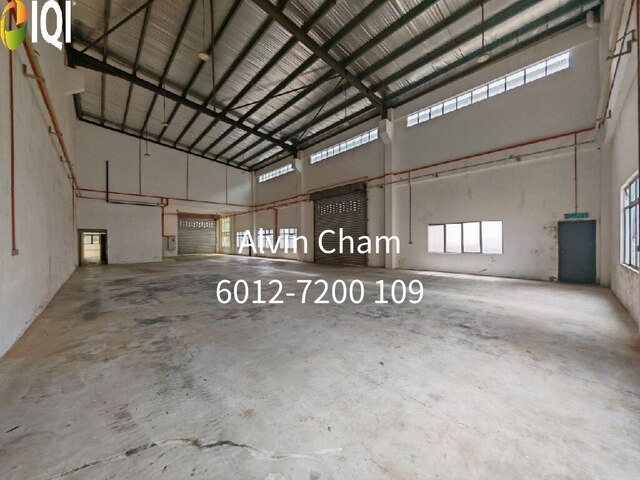
Taman Perindustrian Desa Cemerlang
Jalan Canggih, Taman Desa Cemerlang, Ulu Tiram, Johor
$ 1,456,785
Listed on October 16, 2026

Scott Towers
Off Jalan Datin Halimah, Larkin
$ 147,477
Listed on October 6, 2026
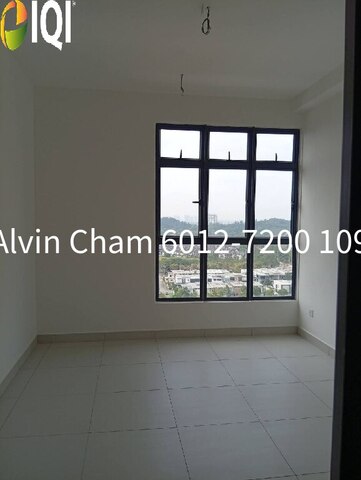
Nusa Heights (Nusa Puncak)
Jalan Idaman 9, Taman Nusa Idaman, Iskandar Puteri (Nusajaya), Johor
$ 197,835
Listed on September 23, 2026
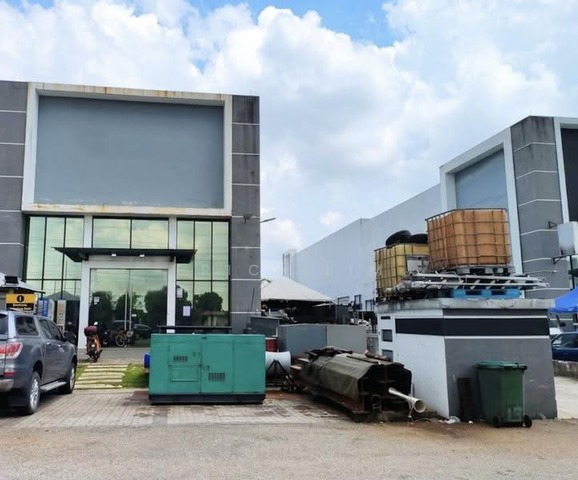
Eco Business Park 3
Taman Kota Masai, 81700 Pasir Gudang
$ 683,430
Listed on November 6, 2026
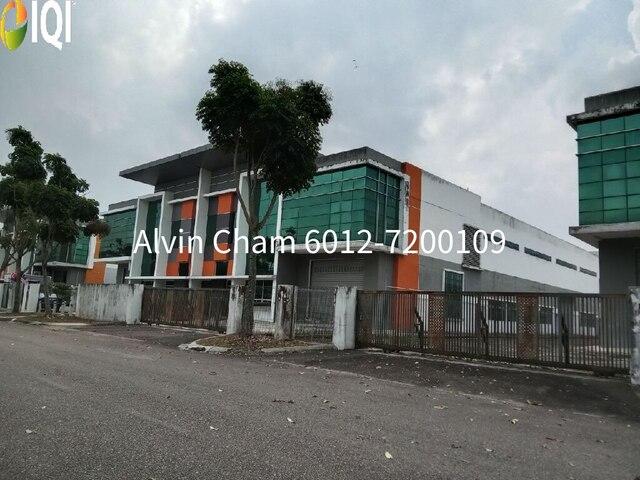
Kawasan Perindustrian Cemerlang
Jalan Maju Cemerlang
$ 2,338,050
Listed on August 28, 2026
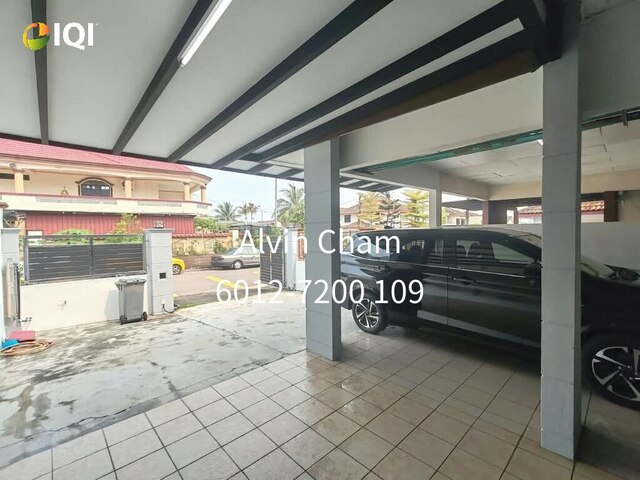
Taman Jaya Mas
Jalan Timur
$ 236,683
Listed on November 13, 2026

Kipark Apartment (KIP Villa Indah)
Jalan Titiwangsa Utama, Taman Tampoi Indah
$ 136,686
Listed on November 13, 2026

Neu Suites
Jalan Nipah
$ 679 /month
Listed on October 10, 2026
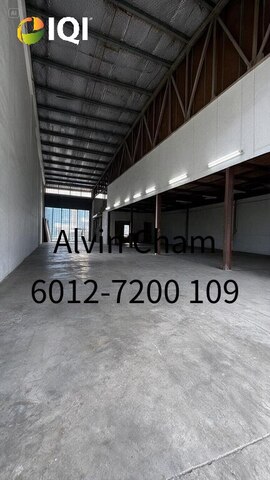
Taman Daya
Jalan Bertam
$ 449,625
Listed on October 30, 2026

Taman Kempas Indah
Jalan Kempas Indah, Taman Kempas Indah
$ 244,596
Listed on October 10, 2026
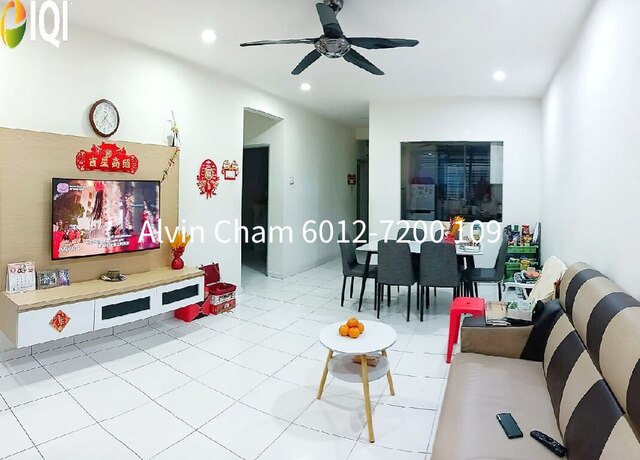
Scott Towers
Off Jalan Datin Halimah, Larkin
$ 143,880
Listed on September 28, 2026
D'Summit Residences
Jln Kempas Utama 2/1, Kempas, Johor Bahru, Johor
$ 99,997
Listed on October 8, 2026
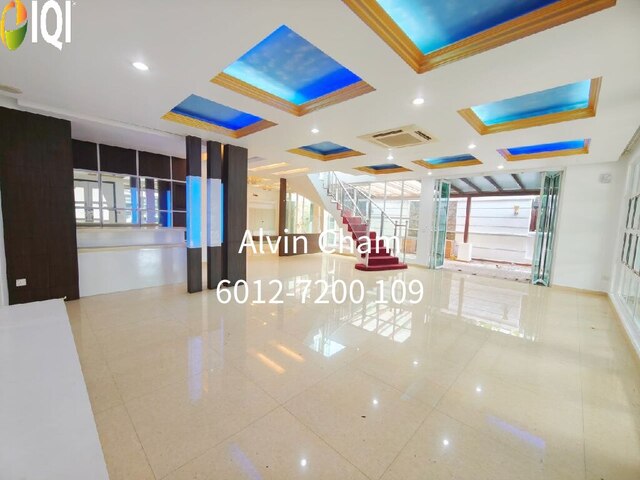
Taman Sutera Utama
Jalan Sutera Pulai 2/1
$ 593,505
Listed on October 12, 2026
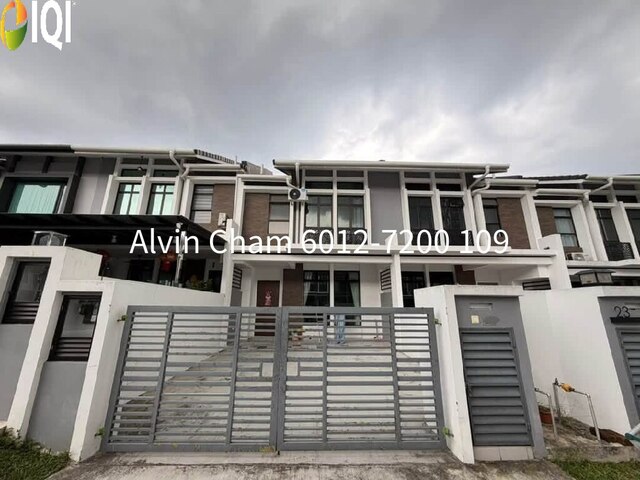
Dahlia @ Seri Austin
Jalan Seri Austin 5
$ 283,444
Listed on September 24, 2026
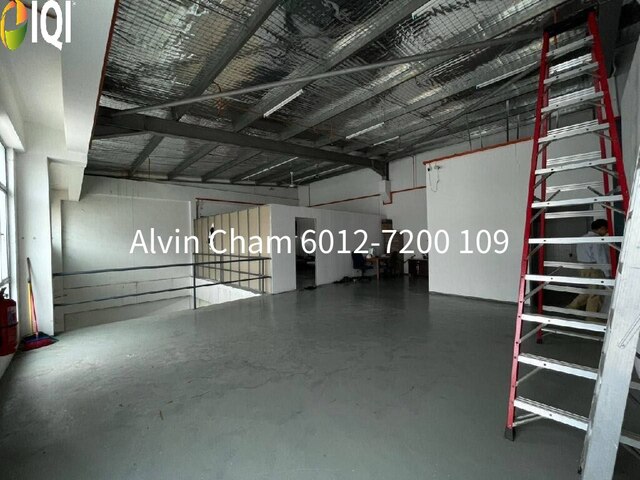
Kawasan Perindustrian SILC
Jalan Gelang Patah
$ 1,025,145
Listed on October 5, 2026
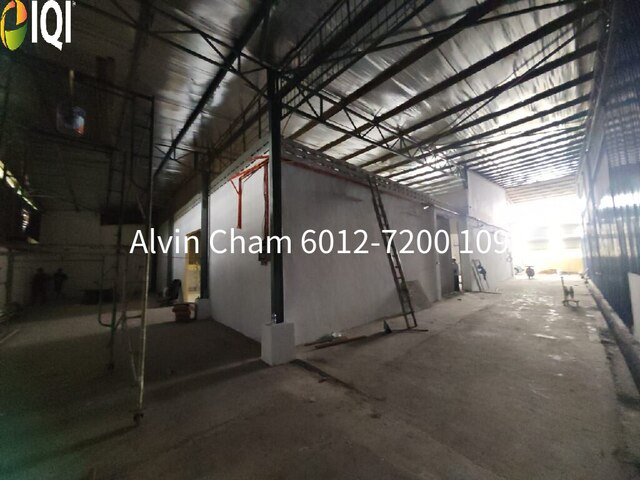
Taman Johor Jaya
Jalan Seroja
$ 1,366,860
Listed on October 4, 2026
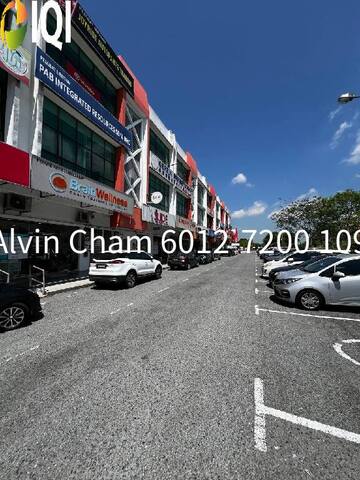
Bandar Uda Utama
Jalan Uda Utma
$ 755,370
Listed on October 5, 2026

Taman Desa Jaya
Jalan Permatang
$ 208,626
Listed on October 15, 2026
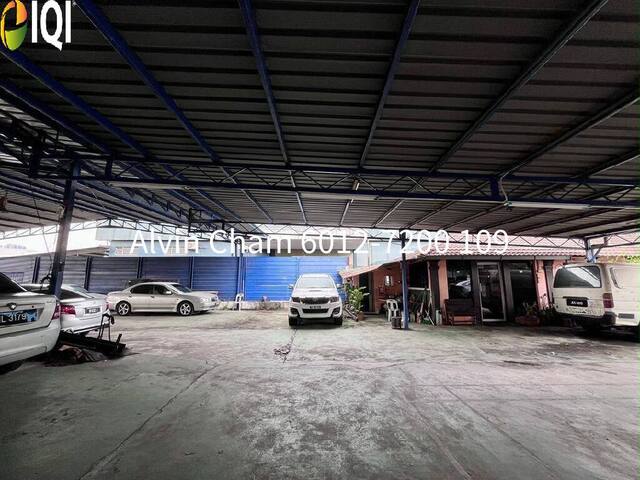
Pasir Gudang Highway
Jalan Pasir Gudang Higway
$ 6,475 /month
Listed on October 5, 2026

Setia Sky 88 (Pangsapuri Setia 88)
Jalan Dato Abdullah Tahir, Johor Bahru
$ 233,805
Listed on September 21, 2026

Taman Industri Jaya
Jalan Bistari
$ 4,676,100
Listed on September 22, 2026

Aspira Gardens
Johor
$ 593,505
Listed on November 3, 2026
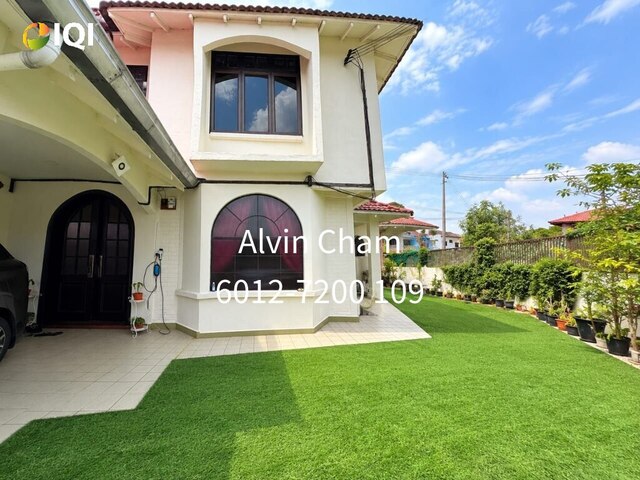
Taman Tun Aminah
Jalan Hang Tuah
$ 348,190
Listed on October 30, 2026
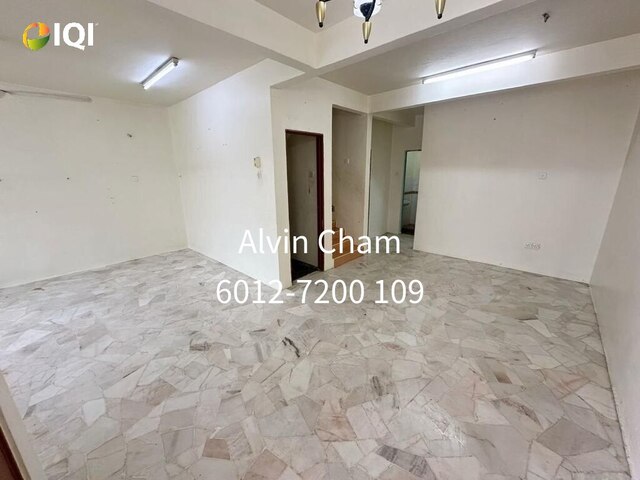
Taman Skudai Bahru
Jalan Hang Tuah
$ 229,489
Listed on November 3, 2026

Nusa Idaman
Jalan Nusa Idaman 3, Taman Nusa Idaman, Iskandar Puteri (Nusajaya), Johor
$ 467,610
Listed on October 30, 2026
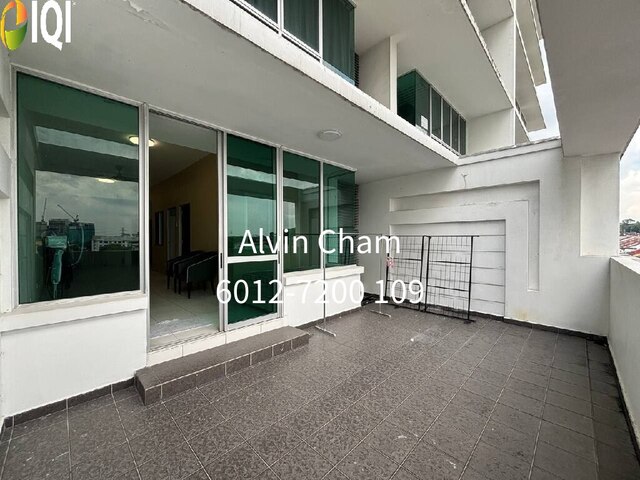
Akademik Suite @ Mount Austin
Jalan Austin Heights Utama
$ 131,291
Listed on October 19, 2026

Danga Sutera
Jalan Danga Sutera, Taman Sutera Utama, Skudai, Johor
$ 377,685
Listed on October 12, 2026
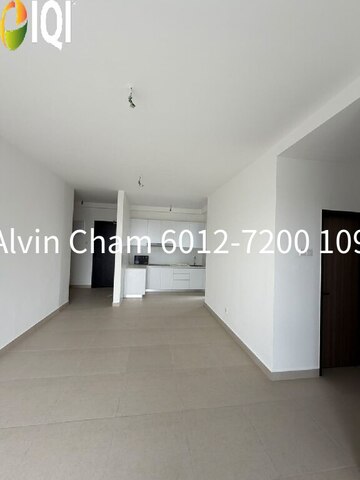
Pandan Heights (Residensi Pandan 3)
Jalan Pandan
$ 183,447
Listed on September 30, 2026
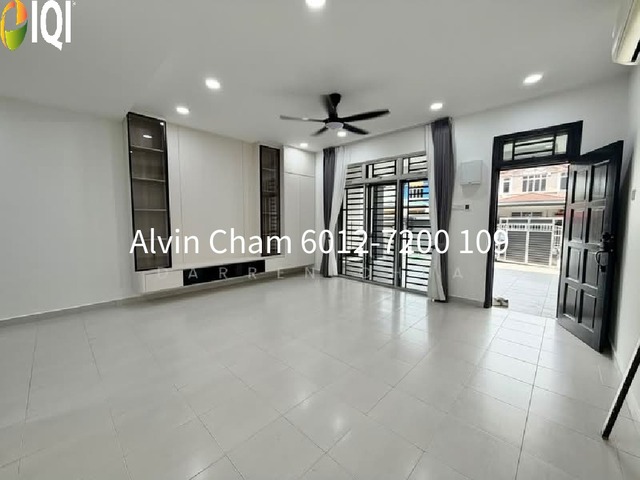
L.A Garden (La Garden Bandar Jaya Putra)
Jln Jaya Putra 5, Bandar Jaya Putra, 81100 Bandar Jaya Putra, Johor Bahru, Johor
$ 276,250
Listed on September 25, 2026
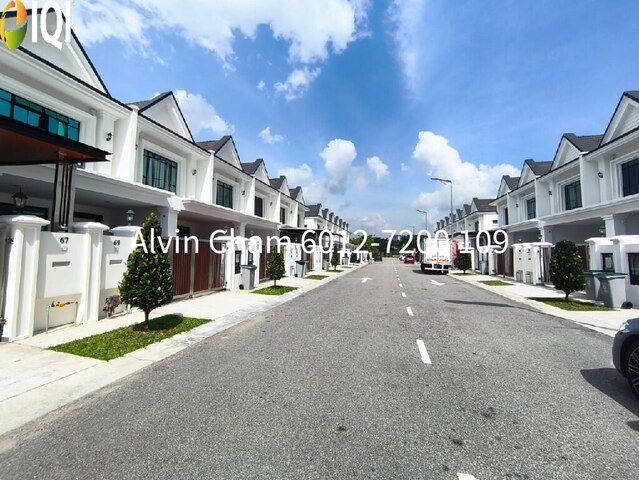
South Hills
Jalan Puncak Selatan, Masai, Johor
$ 291,357
Listed on October 4, 2026

Taman Desa Cemerlang
alan Saga , taman desa cemerlang, Taman Desa Cemerlang, Ulu Tiram, Johor
$ 229,489
Listed on October 19, 2026

D'Summit Residences
Jln Kempas Utama 2/1, Kempas, Johor Bahru, Joho
$ 197,835
Listed on July 17, 2026

Taman Desa Cemerlang
Jalan Kenanga 4, Taman Desa Cemerlang, Ulu Tiram, Johor
$ 442,431
Listed on October 15, 2026
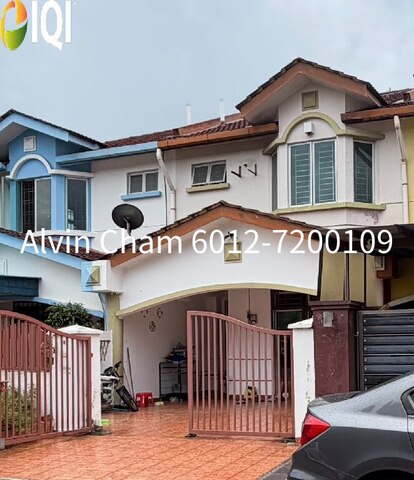
Taman Nusa Bestari 2
Jalan Bestari 6
$ 262,581
Listed on September 21, 2026
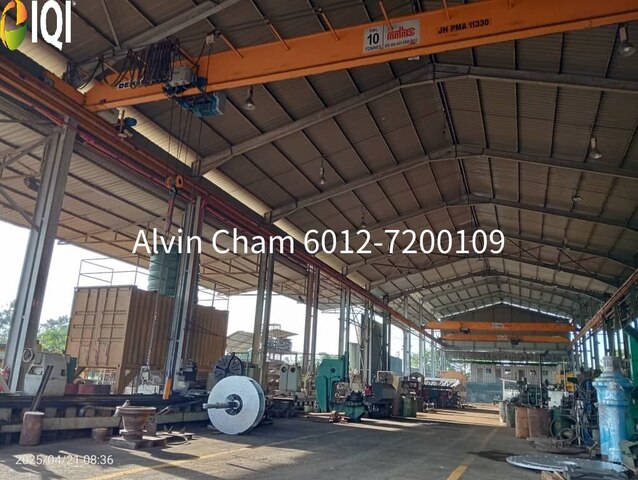
Kampung Seelong Jaya
Jalan Kempas Lama
$ 8,632,800
Listed on April 25, 2025
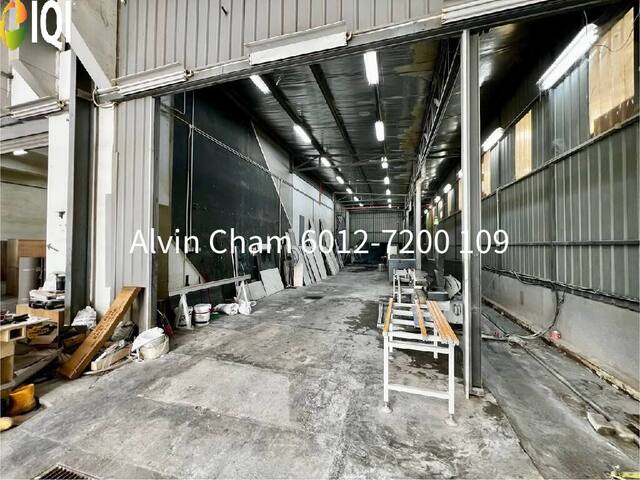
Eco Business Park 1
Jalan Ekoperniagaan 1/5, Eco Business Park 1, Johor Bahru, Johor
$ 1,115,070
Listed on October 7, 2026

SKS Habitat Apartment, Larkin
Jalan Larkin perdana 2
$ 172,656
Listed on October 16, 2026
Our newly launched projects
Discover the real estate properties in and around Johor Bahru, Malaysia. Buy apartment units, landed houses, bungalows, commercial office space, shop lots, and sub-sales with 100% confidence at IQI Global.
 Located in Kubang Semang
Northern TechValley @BKE
Mukim 14, Kubang Semang, 14400 Seberang Perai, Penang, Malaysia
Starting from $ 5,214,039
Listed on January 23, 2026
 Located in Bukit Minyak
Taman IKS Bukit Minyak
Jalan IKS Bukit Minyak Utama, Taman IKS Bukit Minyak, 14100 Simpang Ampat, Penang, Malaysia.
Starting from $ 433,007
Listed on January 23, 2026
 Located in Simpang Ampat
Regalway Industrial Hub (Industrial)
Regalway Industrial Hub, Off Jalan Bukit Panchor, Bukit Panchor, 14100 Simpang Ampat, Penang, Malaysia.
Starting from $ 1,803,896
Listed on January 23, 2026
 Spacious land area
Taman Jasa Ria (Garden Villa)
Jalan Permatang Pasir, Taman Jasa Ria, 14000 Bukit Mertajam, Penang, Malaysia
Starting from $ 402,432
Listed on January 23, 2026
 Larger built-up area
Taman Jasa Intan (Garden Superlink)
Jalan Jasa Intan, Taman Jasa Intan, 14000 Bukit Mertajam, Penang, Malaysia
Starting from $ 294,235
Listed on January 23, 2026
 Located in Nibong Tebal
Taman Fajar Permai (Sunrise Terrace)
Jalan Fajar, Taman Fajar Permai, 14300 Nibong Tebal, Penang, Malaysia.
Starting from $ 197,835
Listed on January 23, 2026
Mortgage Calculator
Calculate your estimated month repayment and plan your monthly expenses well.
The mortgage calculator is intended for reference only. Actual amount may vary.
Monthly Payment
Send me the mortgage calculator result

Home Loan Eligibility Calculator
Calculate your potential loan amount and assess your home buying affordability.

Rental Yield
Calculate the potential rental yield and evaluate a property's investment performance.

Down Payment Saving Plan
Create a structured savings plan and determine how much to save monthly for your down payment plan.

Malaysian Property Transaction Fees Calculator
Estimate the total transaction fees and budget accurately for your Malaysian property purchase.
IQI blog & news
Articles specifically curated for your daily digest of local and global real estate news.

Australia’s Property Market Shifts in Buyers’ Favour Australia’s housing market continued to soften in September, creating a more favourable environment for buyers who are prepared to take a longer-term view. Cotality’s national Home Value Index fell 1.1% during the month, leaving dwelling values 5.2% below their March 2026 peak. Higher interest rates, affordability pressures and living costs continue to weigh on demand, but lower prices are also opening more accessible entry points for financially prepared purchasers. Performance varied significantly across capital cities. Brisbane declined 1.5%, Sydney fell 1.4%, while Melbourne recorded a smaller 0.7% decline. Darwin was the only capital to post monthly growth. On an annual basis, Darwin and Perth remained standouts, recording gains of 11.9% and 10.1%, respectively. More Choice and Less Competition Buyers are also benefiting from higher stock levels. Total advertised listings across the combined capitals were 23.1% higher than a year earlier, while the median selling period increased from 23 days to 39 days. This gives purchasers more time to compare properties, conduct due diligence and negotiate. Meanwhile, estimated national transactions over the previous three months were 19.1% lower year-on-year, pointing to reduced competition across much of the market. Outlook The timing of a broader market recovery remains uncertain, but softer prices and greater choice are giving buyers and investors more room to be selective. Property quality, local demand and manageable holding costs will remain important considerations, particularly as market performance continues to differ significantly between cities. The contents of this article were contributed by Lily Chong, Head of IQI Australia. Download to see insights from other country marketsDownload

Housing Weakness Spreads Across Capital Cities Australia’s housing slowdown intensified through winter, with home values declining across 93% of capital-city suburbs, more than double the 45.8% recorded during autumn. Darwin was the only capital city to avoid a decline over the three-month period. Cotality’s national Home Value Index fell 0.9% in August, marking the fifth consecutive monthly decline. National home values are now 3.6% below the March market peak. Sydney remained the weakest capital-city market, falling 1.4% in August and sitting 7.1% below its February peak. Melbourne and Canberra each declined 1.1%, while Brisbane fell 1.0%. Adelaide and Perth both recorded a 0.8% decrease, highlighting the increasingly broad nature of the downturn. Slower Sales Strengthen Buyer Conditions High borrowing costs, tighter lending conditions and affordability pressures continue to weigh on demand. Quarterly home sales were 15.5% lower than a year earlier and 11.5% below the five-year average, with Brisbane, Perth and Sydney recording annual declines of more than 20%. At the same time, capital-city listings were 24% higher than a year ago. Longer selling periods, greater vendor discounts and softer auction-clearance rates are creating more buyer-favourable conditions, although weak confidence continues to limit transaction activity. Outlook Australia’s housing market is likely to remain selective and buyer-driven in the near term. Elevated stock levels and softer demand may continue to pressure values, while buyers with strong financing positions could benefit from greater choice and improved negotiating power. For investors and homeowners, markets such as Perth may still present opportunities for those taking a long-term view. The contents of this article were contributed by Lily Chong, Head of IQI Australia. Download to see insights from other country marketsDownload
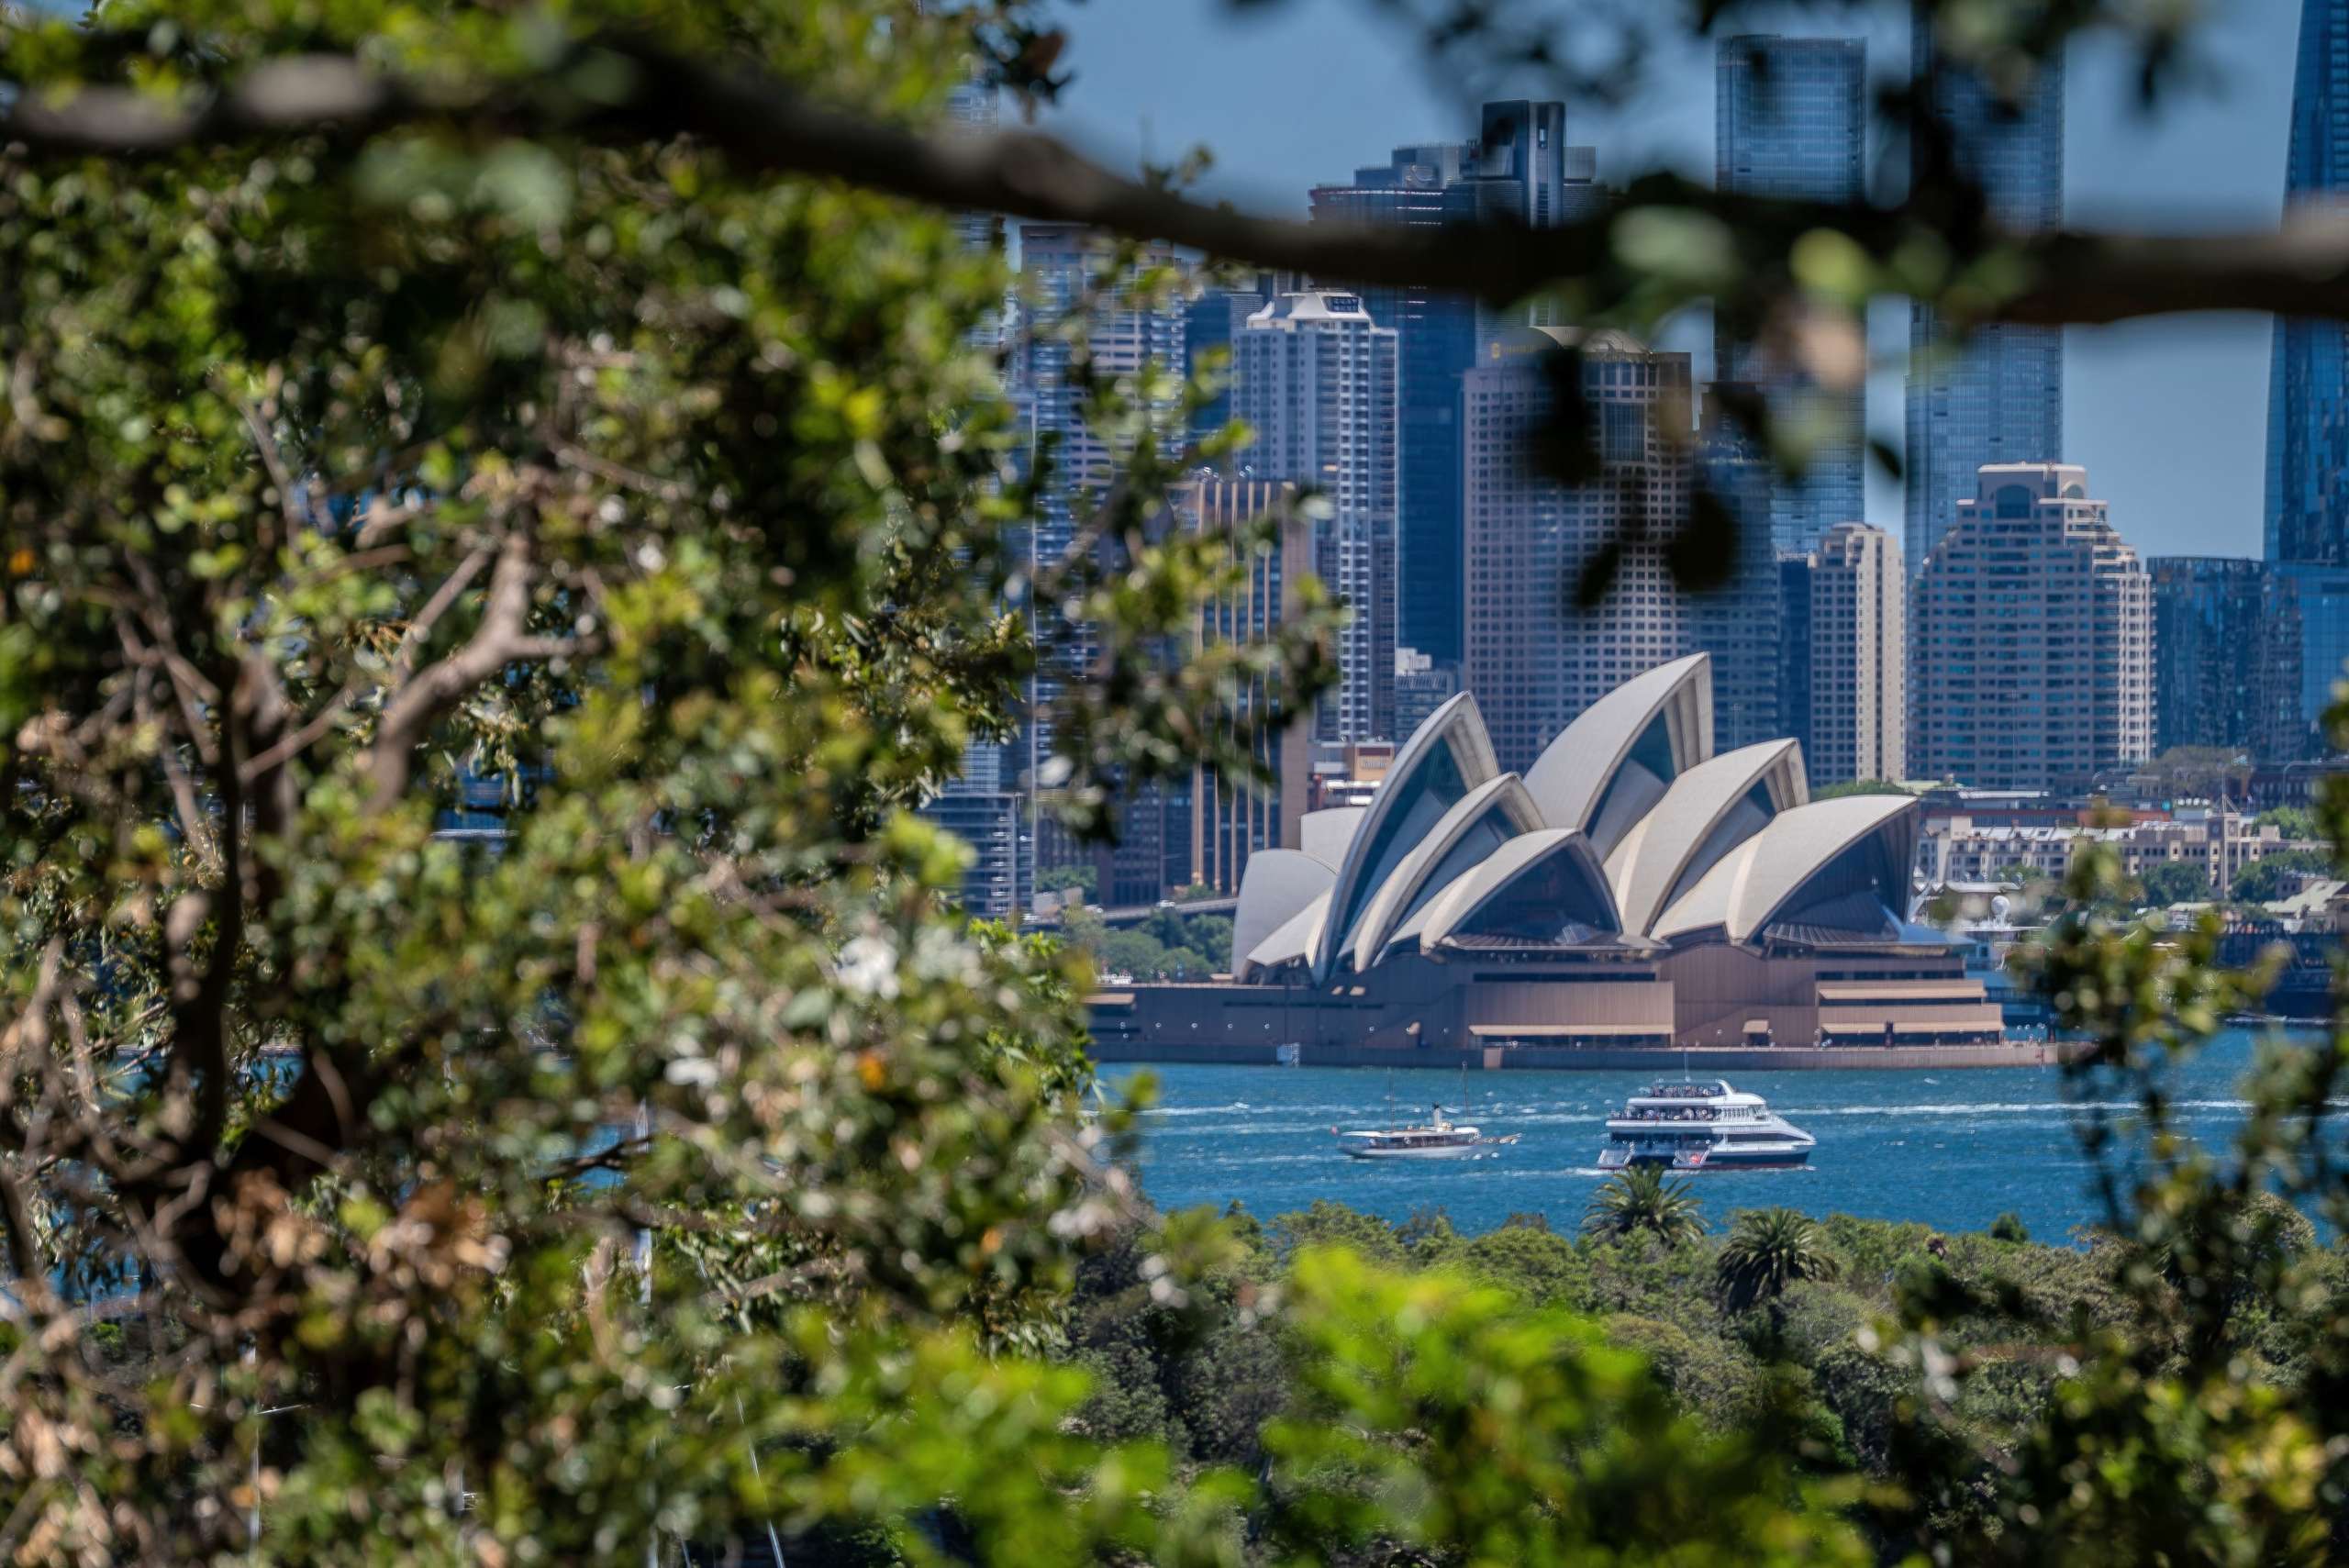
Australia’s Housing Downturn Spreads Australia’s housing market lost further momentum in July, with Cotality’s national Home Value Index falling 0.7%, its largest monthly decline in more than three years. Sydney and Melbourne remained the weakest major markets, with home values falling 1.4% and 1.2% respectively during the month. However, the slowdown is becoming more widespread. Brisbane declined 0.6%, while Adelaide fell 0.2%, with both cities recording two consecutive months of falling values following historical revisions. Perth showed a small 0.1% monthly increase, although its June result was revised to a 0.5% decline, signalling how quickly conditions have shifted from the city’s earlier growth phase. Premium Homes Feel More Pressure The correction has been particularly noticeable at the higher end of the market. Values in the upper quartile fell 3.2% over the three months to July, compared with a 0.3% gain among lower-value properties. Several factors are weighing on demand, including affordability constraints, three cash-rate increases and weak consumer confidence. At the same time, advertised housing supply has increased. Capital-city auction clearance rates have remained below 50%, suggesting buyers and sellers are still struggling to agree on pricing. Outlook Australia’s housing market is likely to remain price-sensitive and uneven across cities and property segments in the near term. With higher-value homes experiencing the greatest pressure, buyers may gain greater negotiating power in selected markets. For homeowners and investors, conditions will require closer attention to local demand, pricing and affordability rather than relying on broader national trends. The contents of this article were contributed by Lily Chong, Head of IQI Australia. Download to see insights from other country marketsDownload
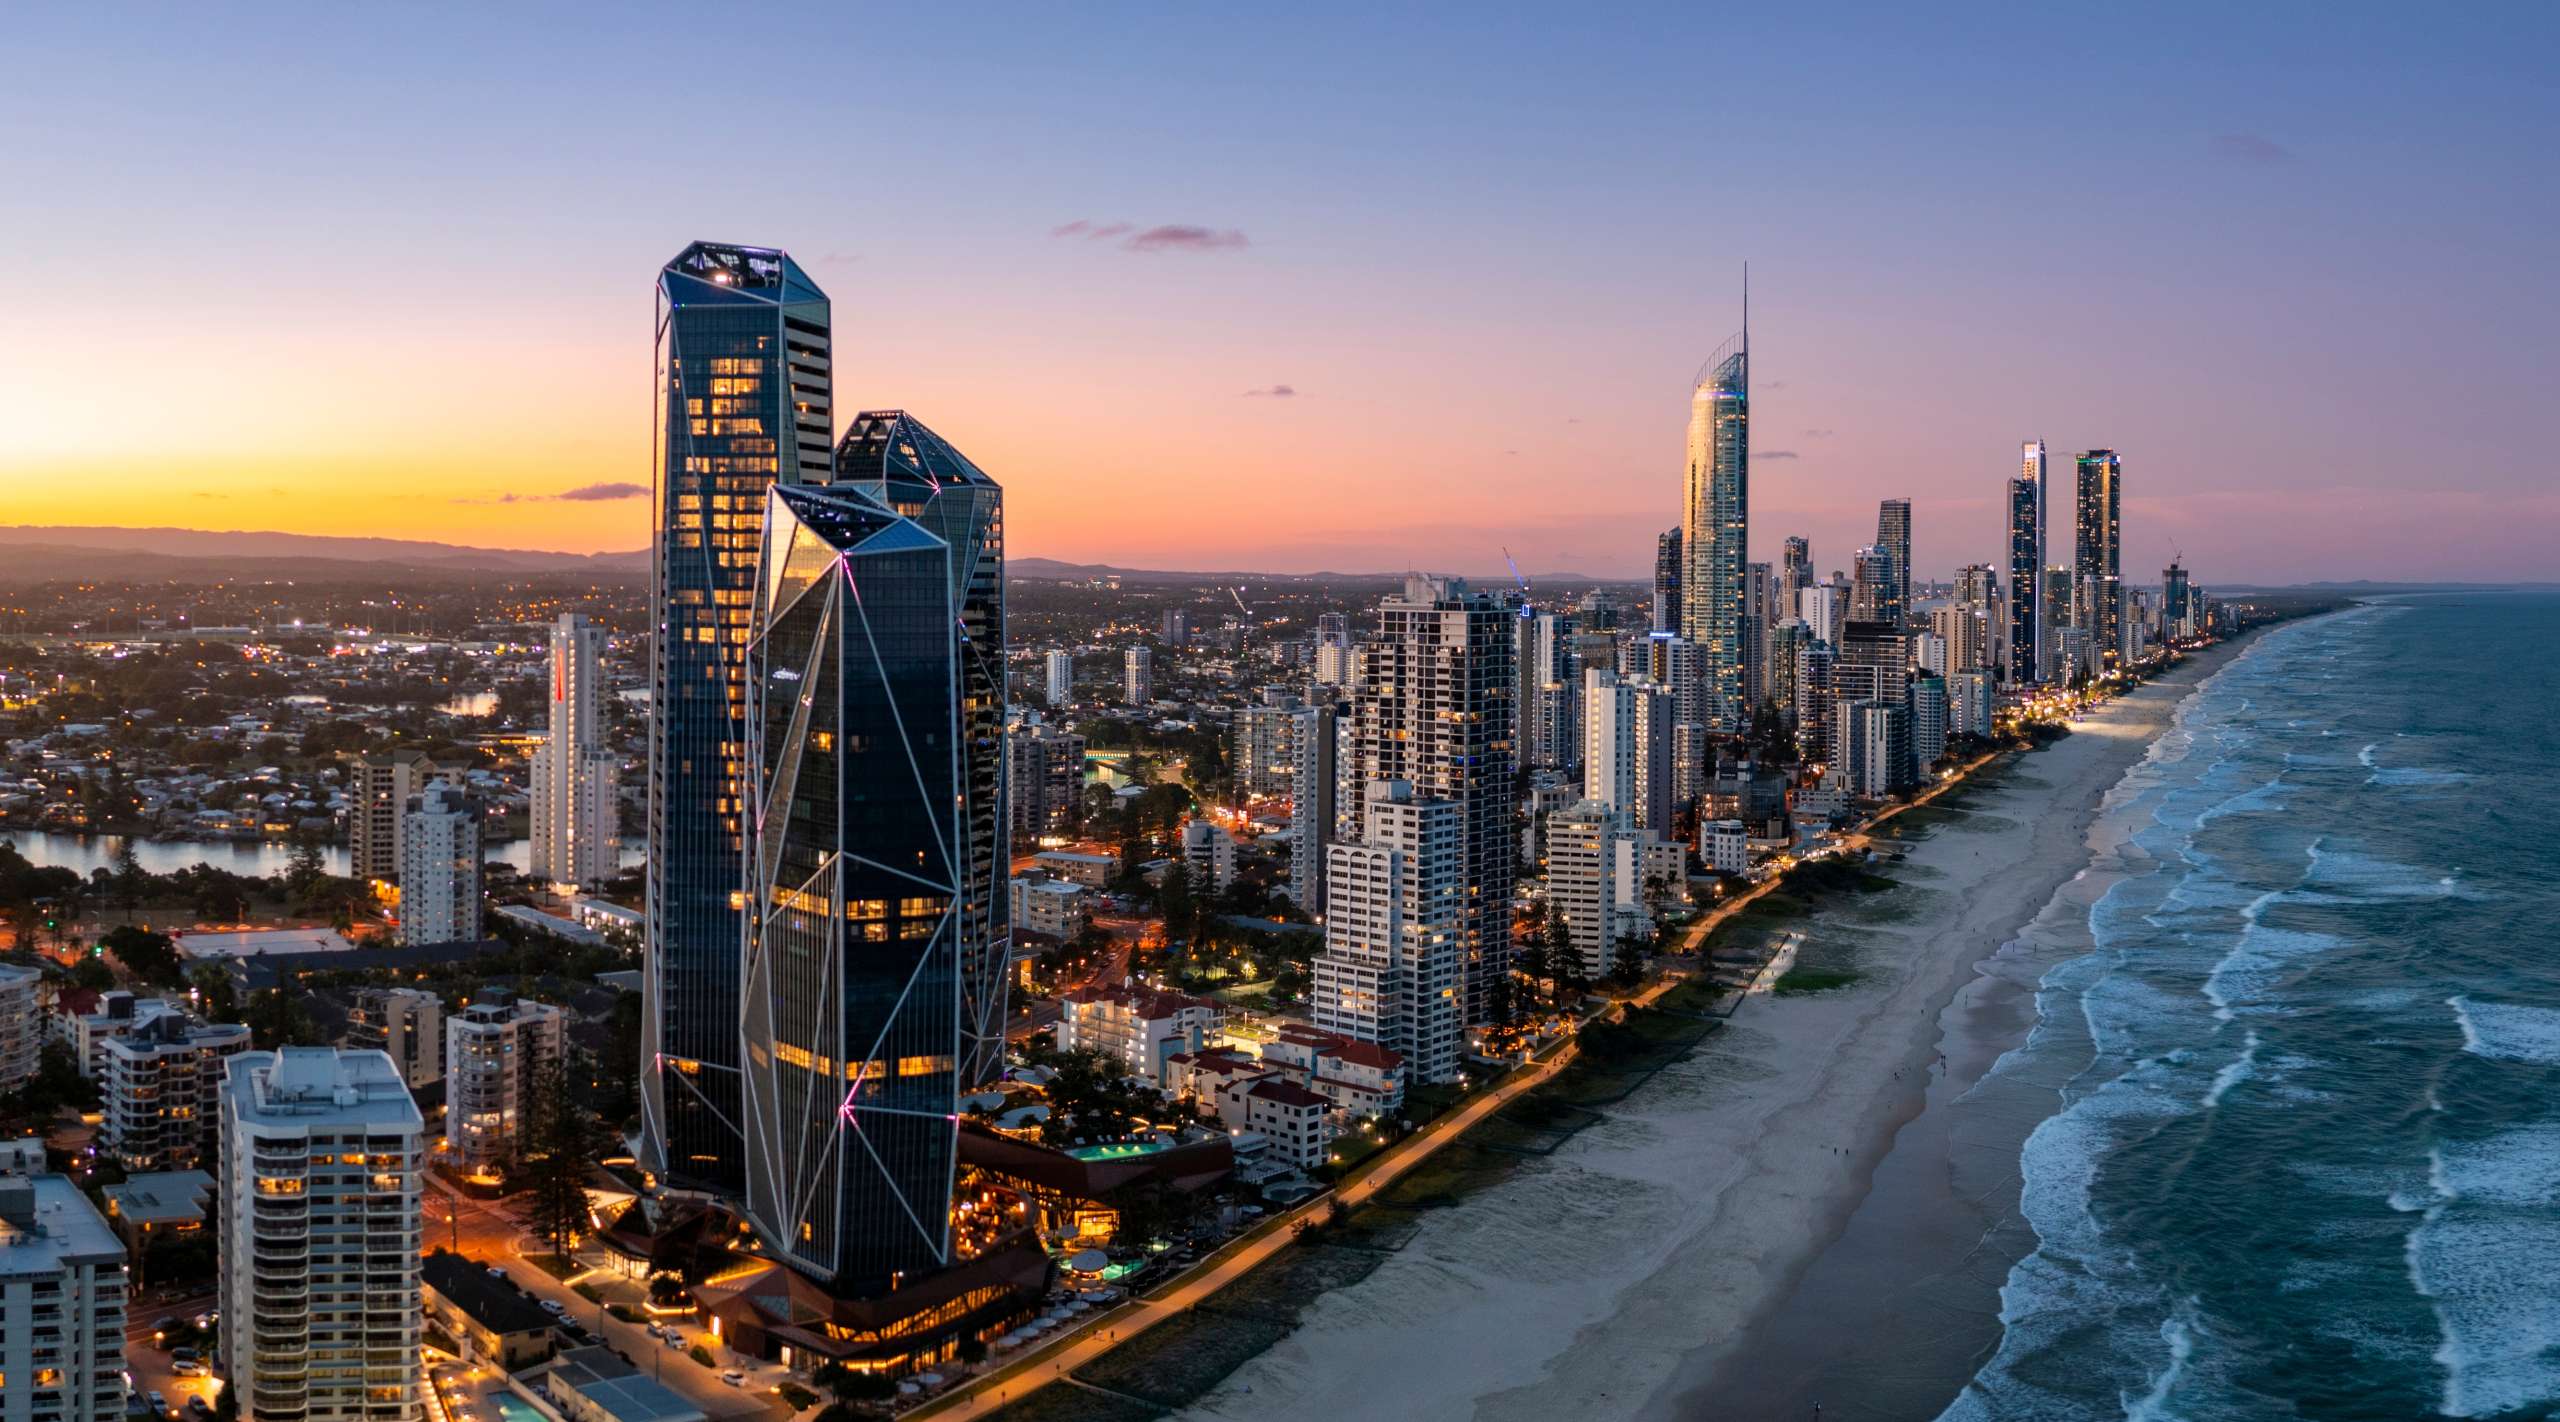
Australia’s Housing Market Enters a Cooling Phase Australia’s housing market shifted in June 2026, with the national Home Value Index falling 0.4% month-on-month. This was the largest monthly decline recorded since December 2022. Sydney experienced the sharpest correction, with dwelling values falling 1.2%, followed by Melbourne at 1.0% and Canberra at 0.6%. Adelaide remained unchanged, while Brisbane and Perth continued to grow by 0.3% and 0.7%respectively. Over the June quarter, national dwelling values declined 0.7%, while combined capital city values fell 1.3%. The slowdown was mainly driven by weaker buyer demand and growing affordability pressures. Market Conditions Become More Buyer-Friendly Higher interest rates, cost-of-living pressures, cautious buyer sentiment and recent property tax changes have contributed to softer market conditions. Auction clearance rates across the combined capital cities have remained below 50% since late May. Capital city sales volumes were also estimated to be 16.2% lower year-on-year. Meanwhile, advertised listings increased by almost 11% compared with the previous year. This has given buyers more options, reduced urgency and placed greater pressure on sellers to set realistic asking prices. Despite the national slowdown, market performance remains uneven. Perth recorded the strongest annual growth among the major capital cities at 23.9%, while Brisbane increased 17.4%, highlighting continued demand in selected markets. Outlook Australia’s housing market is likely to remain more balanced and selective in the coming months. Buyers may benefit from wider choice and improved negotiating power, while sellers will need to align pricing expectations with changing demand. Markets with stronger population growth, affordability and supply fundamentals, particularly Perth, may remain more resilient than Sydney and Melbourne. Download to see insights from other country marketsDownload
Ready to get started?
Get in touch now.
